

Question: Question 9 Figure 8-2 The vertical distance between points C and D represents a tax in the market. PRICE 24 18 16 14 22201200
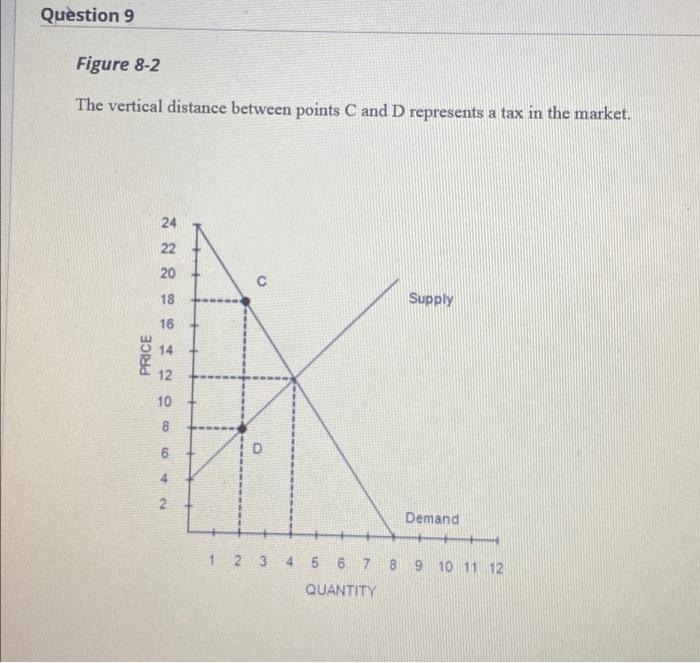
Question 9 Figure 8-2 The vertical distance between points C and D represents a tax in the market. PRICE 24 18 16 14 22201200 8 6 4 2 + 2 3 4 5 Supply Demand 6 7 8 9 10 11 12 QUANTITY
Step by Step Solution
There are 3 Steps involved in it
1 Expert Approved Answer
Step: 1 Unlock

Question Has Been Solved by an Expert!
Get step-by-step solutions from verified subject matter experts
Step: 2 Unlock
Step: 3 Unlock