

Question: Question 9: Is the following control chart in control why or why not? ? Provide the control chart with all zones labeled. Assume the mean
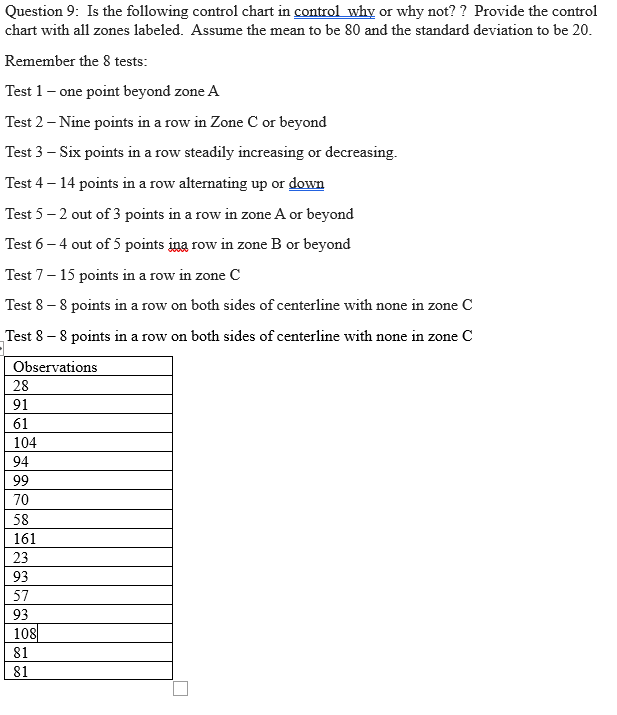
Question 9: Is the following control chart in control why or why not? ? Provide the control chart with all zones labeled. Assume the mean to be 80 and the standard deviation to be 20 Remember the 8 tests: Test 1 - one point beyond zone A Test 2 - Nine points in a row in Zone C or beyond Test 3 - Six points in a row steadily increasing or decreasing. Test 4 - 14 points in a row alternating up or down Test 5 -2 out of 3 points in a row in zone A or beyond Test 6 -4 out of 5 points ina row in zone B or beyond Test 7 - 15 points in a row in zone C Test 8 - 8 points in a row on both sides of centerline with none in zone C Test 8 - 8 points in a row on both sides of centerline with none in zone C Observations 28 91 61 104 94 99 70 58 161 23 93 57 93 108 81 81
Step by Step Solution
There are 3 Steps involved in it

Get step-by-step solutions from verified subject matter experts