

Question: (Question 2: Is the following control chart 1n control why or why not? Prowvide the control chart with all zones labeled. Assume the mean to
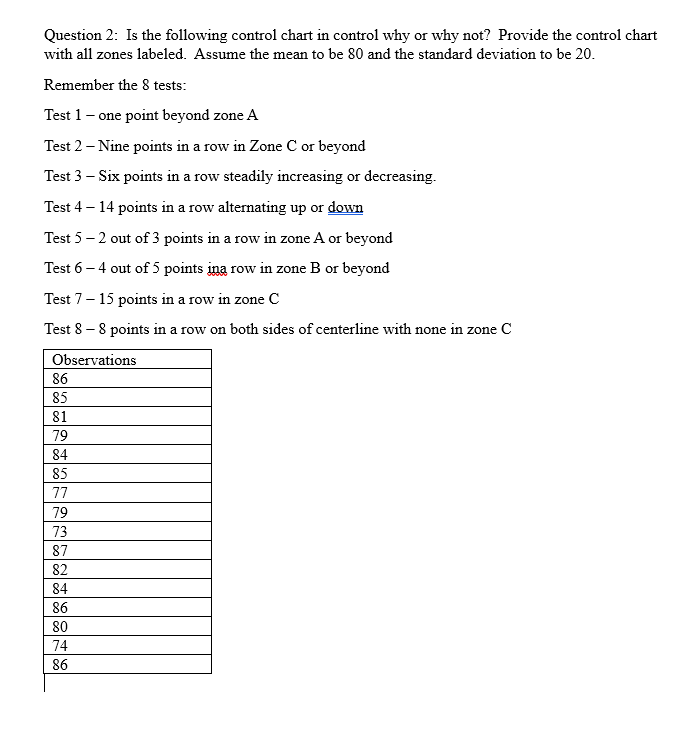
(Question 2: Is the following control chart 1n control why or why not? Prowvide the control chart with all zones labeled. Assume the mean to be 80 and the standard deviation to be 20. Remember the 8 tests: Test 1 one point beyond zone A Test 2 Nine points in a row i1 Zone C or beyond Test 3 Six points 1n a row steadily increasing or decreasing. Test 4 14 points 1n a row alternating up or down Test 5 2 out of 3 points 1n a row in zone A or beyond Test 6 4 out of 5 points 1na row 1 zone B or beyond Test 7 13 points in a row in zone C Test & 8 points 1n a row on both sides of centerline with none in zone C
Step by Step Solution
There are 3 Steps involved in it
1 Expert Approved Answer
Step: 1 Unlock

Question Has Been Solved by an Expert!
Get step-by-step solutions from verified subject matter experts
Step: 2 Unlock
Step: 3 Unlock