

Question: Question about the data analysis Example Le Forty students each took ten shots with a basketball from the free throw line. The random variable is
Question about the data analysis
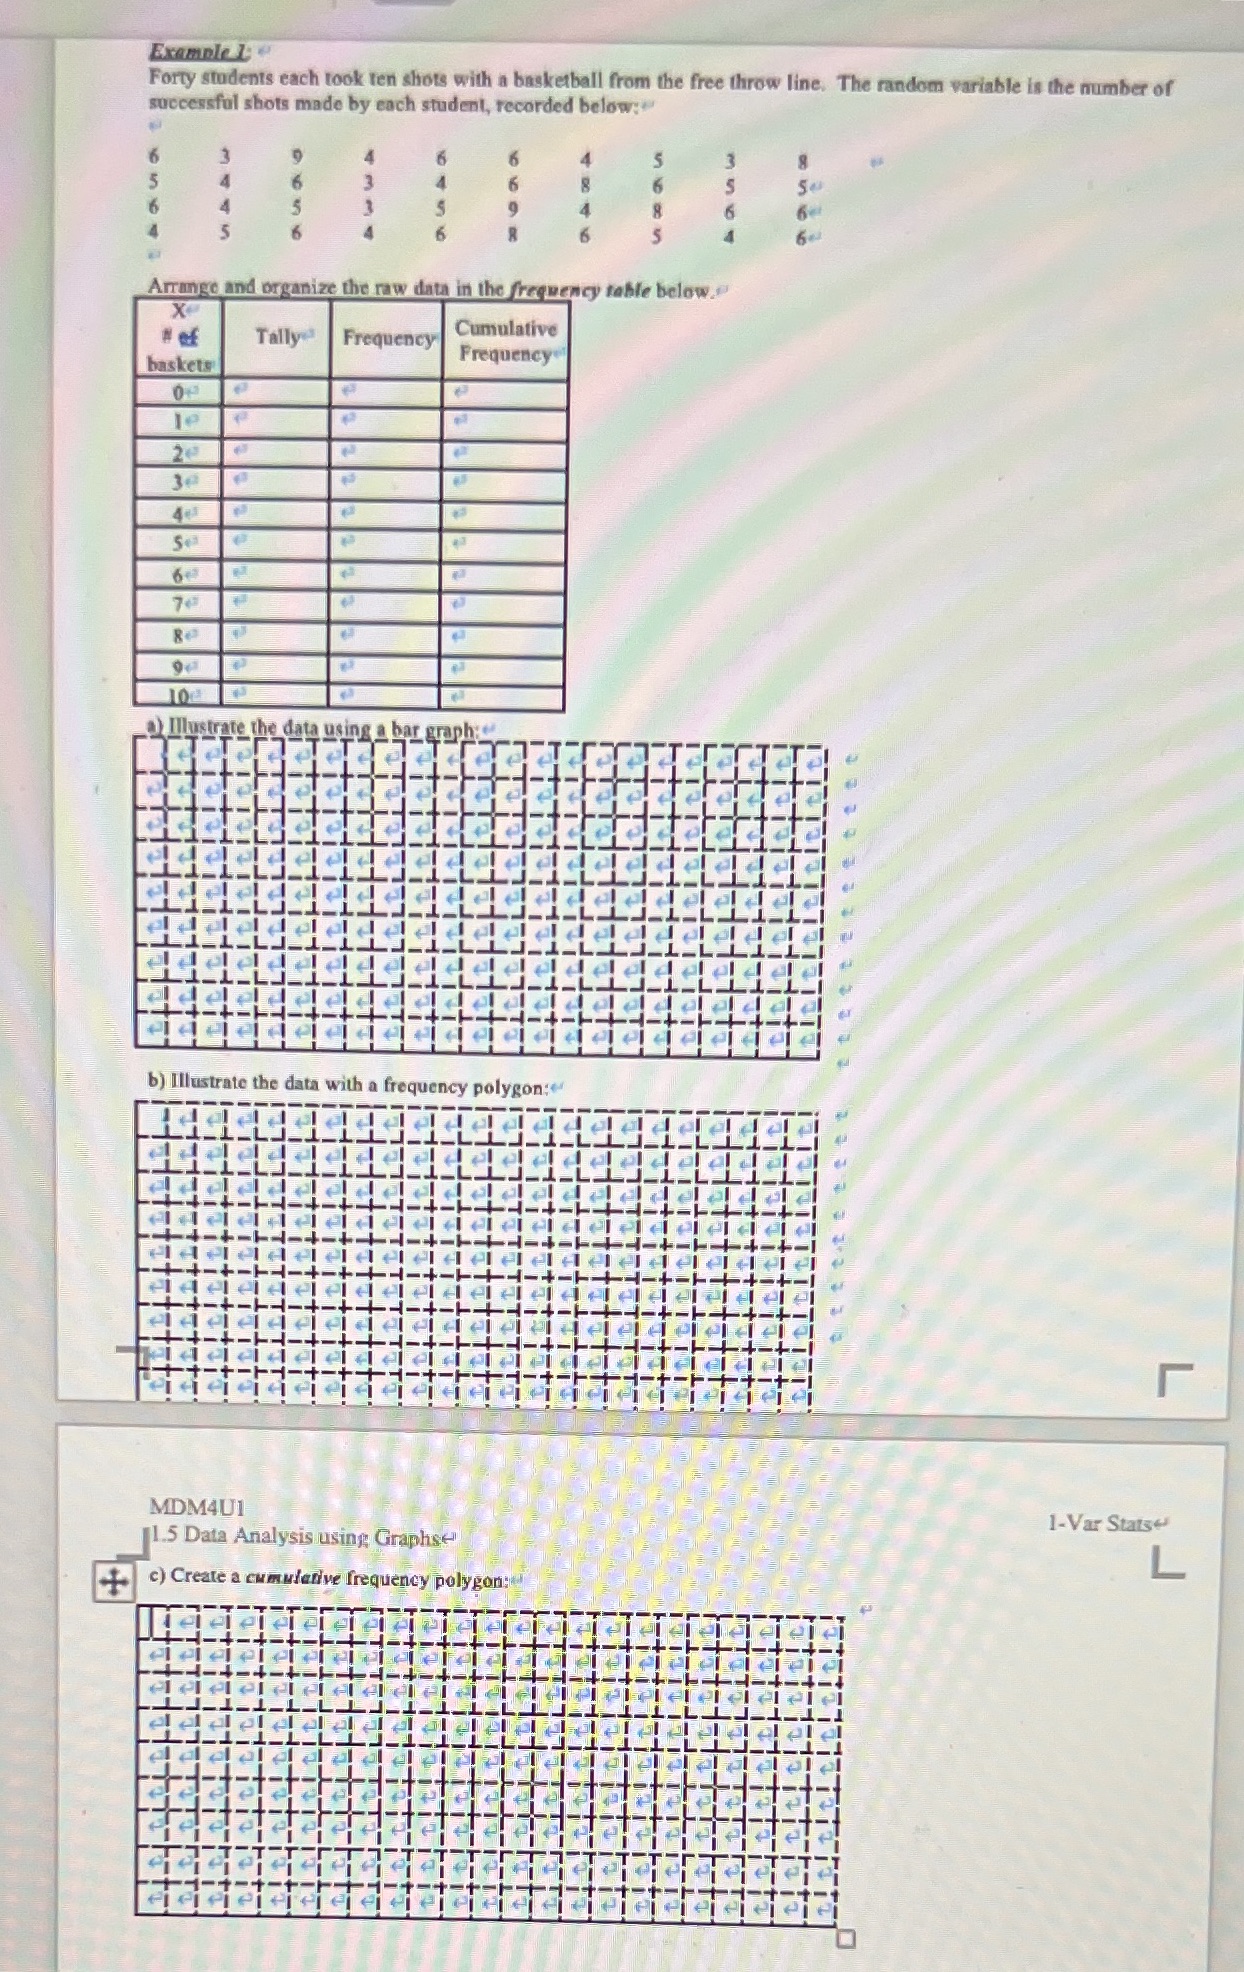
Example Le Forty students each took ten shots with a basketball from the free throw line. The random variable is the number of successful shots made by each student, recorded below: Arrange and organize the raw data in the frequency table below. X of Tally Frequency Cumulative baskets Frequency le 20 ) Illustrate the data using a bar gr b) Illustrate the data with a frequency polygon: r MDM4U1 1-Var Stats 1.5 Data Analysis using Graphs c) Create a cumulative frequency polygon
Step by Step Solution
There are 3 Steps involved in it
1 Expert Approved Answer
Step: 1 Unlock

Question Has Been Solved by an Expert!
Get step-by-step solutions from verified subject matter experts
Step: 2 Unlock
Step: 3 Unlock