

Question: Question Below 10 2000 A B Surface area 103 1500 102 500 Surface area iii 1000 101 0 1 2 3 4 5 6 7
Question Below
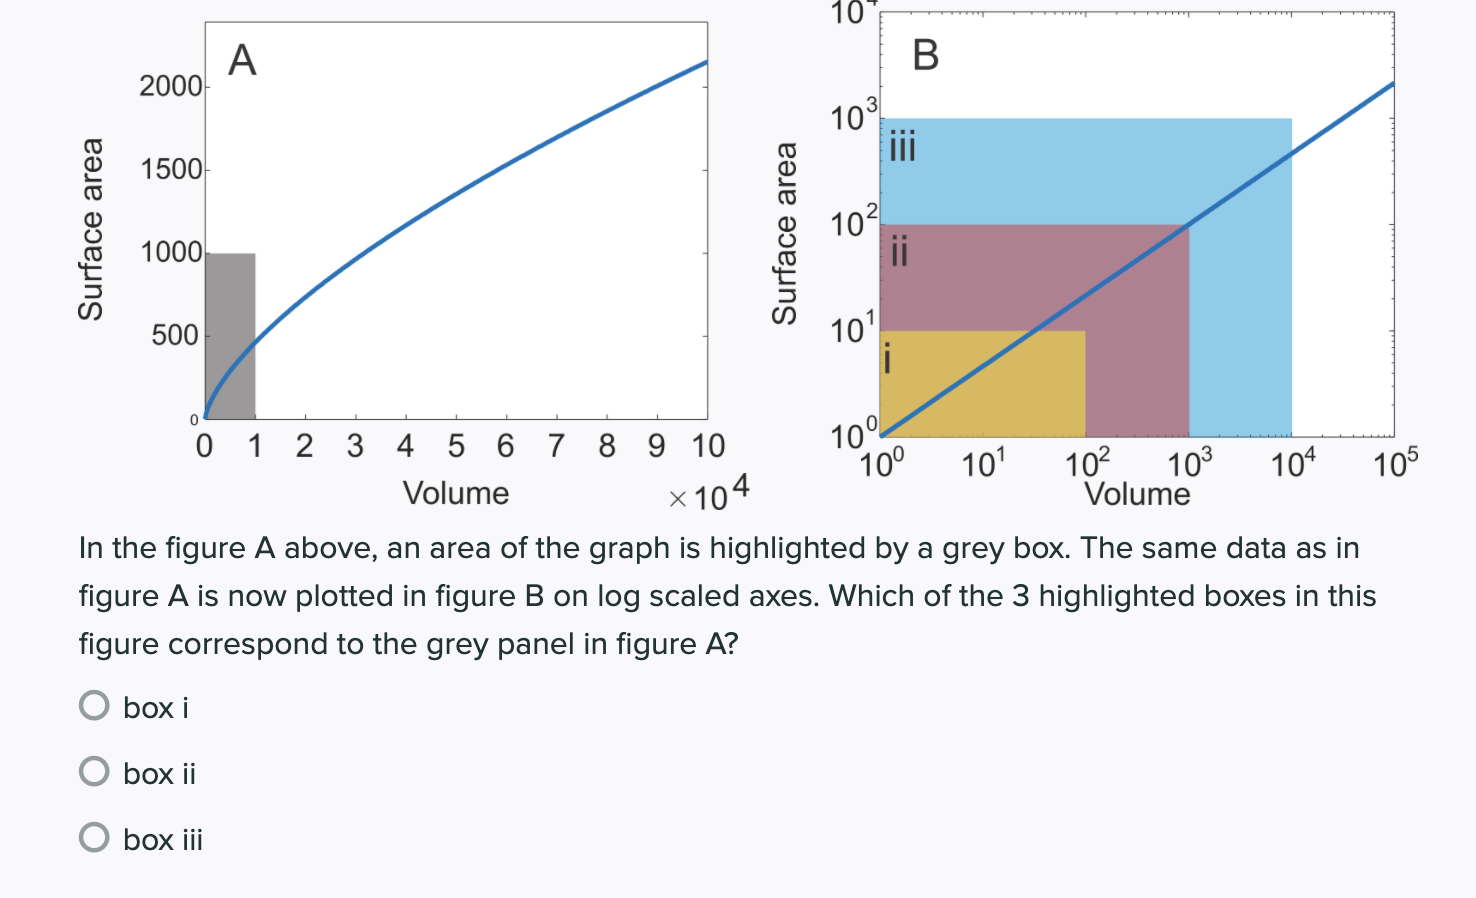
10 2000 A B Surface area 103 1500 102 500 Surface area iii 1000 101 0 1 2 3 4 5 6 7 8 9 10 100 Volume x 104 100 101 102 103 Volume 104 105 In the figure A above, an area of the graph is highlighted by a grey box. The same data as in figure A is now plotted in figure B on log scaled axes. Which of the 3 highlighted boxes in this figure correspond to the grey panel in figure A? O box i O box ii O box
Step by Step Solution
There are 3 Steps involved in it
1 Expert Approved Answer
Step: 1 Unlock

Question Has Been Solved by an Expert!
Get step-by-step solutions from verified subject matter experts
Step: 2 Unlock
Step: 3 Unlock