

Question: A quality analyst wants to construct a control chart for determining whether three machines, all producing the same product, are in control with regard to
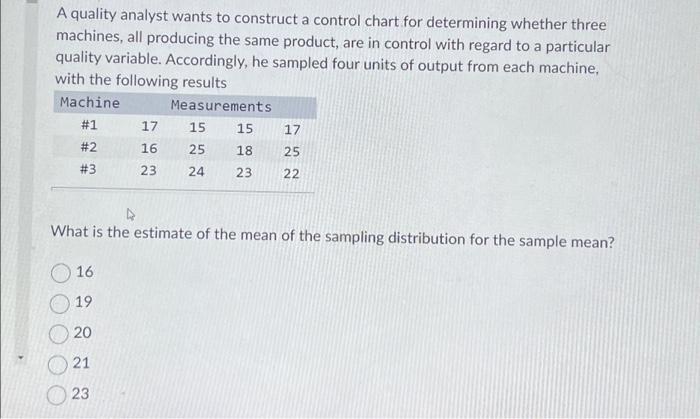
A quality analyst wants to construct a control chart for determining whether three machines, all producing the same product, are in control with regard to a particular quality variable. Accordingly, he sampled four units of output from each machine, with the following results Machine Measurements #1 #2 #3 16 19 17 16 23 20 21 23 15 25 24 D What is the estimate of the mean of the sampling distribution for the sample mean? 15 18 23 17 25 22
A quality analyst wants to construct a control chart for determining whether three machines, all producing the same product, are in control with regard to a particular quality variable. Accordingly, he sampled four units of output from each machine, with the following results What is the estimate of the mean of the sampling distribution for the sample mean? 16 19 20 21 23
Step by Step Solution
There are 3 Steps involved in it
1 Expert Approved Answer
Step: 1 Unlock

Question Has Been Solved by an Expert!
Get step-by-step solutions from verified subject matter experts
Step: 2 Unlock
Step: 3 Unlock