

Question: Please solve in excel and provide the formula and chart please A quality analyst wants to construct a control chart for determining whether three machines,
Please solve in excel and provide the formula and chart please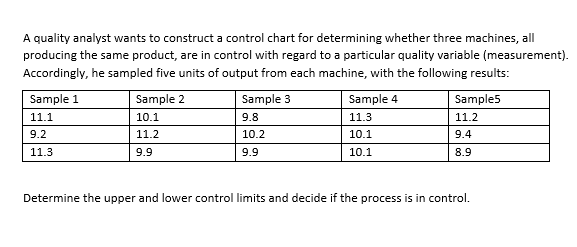
A quality analyst wants to construct a control chart for determining whether three machines, all producing the same product, are in control with regard to a particular quality variable (measurement). Accordingly, he sampled five units of output from each machine, with the following results: Determine the upper and lower control limits and decide if the process is in control. A quality analyst wants to construct a control chart for determining whether three machines, all producing the same product, are in control with regard to a particular quality variable (measurement). Accordingly, he sampled five units of output from each machine, with the following results: Determine the upper and lower control limits and decide if the process is in control
Step by Step Solution
There are 3 Steps involved in it

Get step-by-step solutions from verified subject matter experts