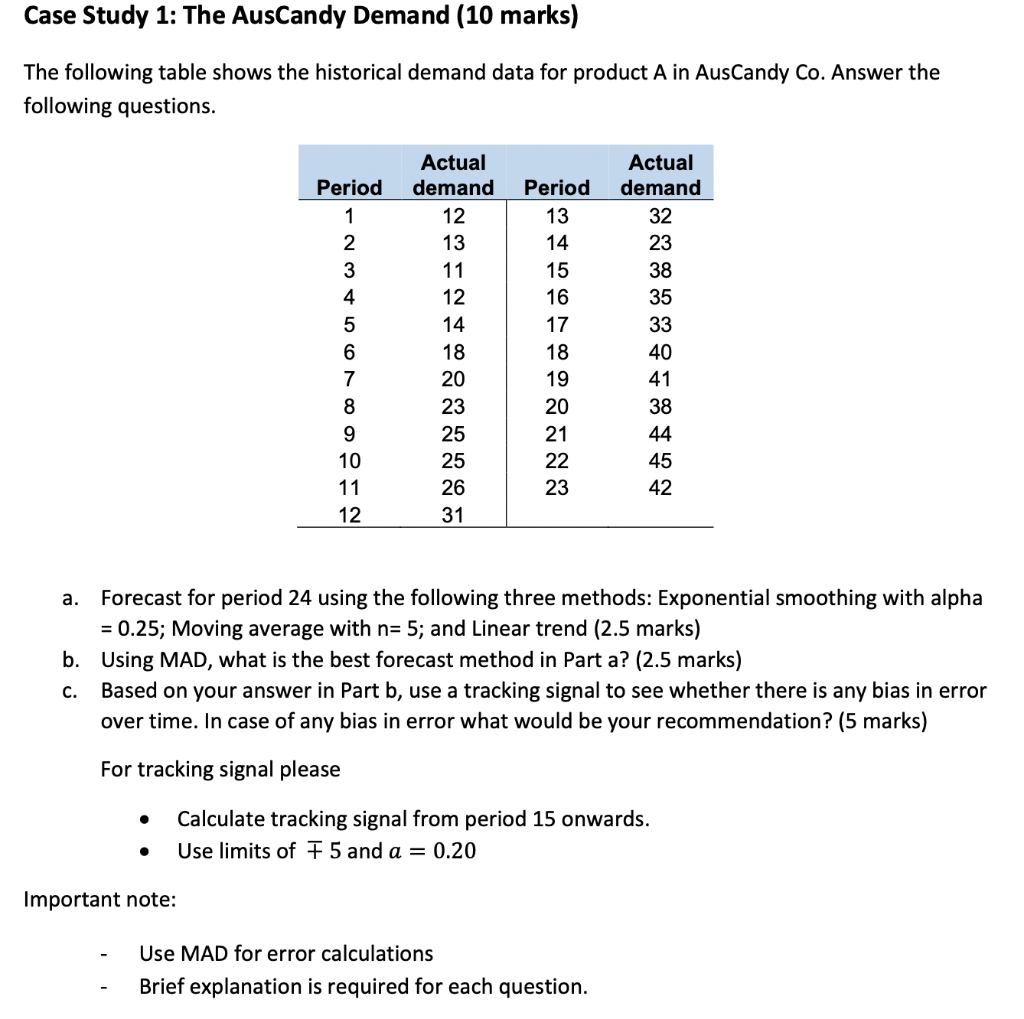
Question: Question c case study 1 Case Study 1: The AusCandy Demand (10 marks) The following table shows the historical demand data for product A in

Question c case study 1

Question c case study 1 Case Study 1: The

Case Study 1: The AusCandy Demand (10 marks) The following table shows the historical demand data for product A in AusCandy Co. Answer the following questions. Period 1 2 3 4 5 6 7 8 9 10 11 12 Actual demand 12 13 11 12 14 18 20 23 25 25 26 31 Period 13 14 15 16 17 18 19 20 21 22 23 Actual demand 32 23 38 35 33 40 41 38 44 45 42 a. Forecast for period 24 using the following three methods: Exponential smoothing with alpha = 0.25; Moving average with n= 5; and Linear trend (2.5 marks) b. Using MAD, what is the best forecast method in Part a? (2.5 marks) C. Based on your answer in Part b, use a tracking signal to see whether there is any bias in error over time. In case of any bias in error what would be your recommendation? (5 marks) For tracking signal please Calculate tracking signal from period 15 onwards. Use limits of 7 5 and a = 0.20 . Important note: Use MAD for error calculations Brief explanation is required for each

Step by Step Solution

There are 3 Steps involved in it

1 Expert Approved Answer
Step: 1 Unlock blur-text-image
Question Has Been Solved by an Expert!

Get step-by-step solutions from verified subject matter experts

Step: 2 Unlock
Step: 3 Unlock

Students Have Also Explored These Related General Management Questions!