

Question: QUESTION: Calculate the upper and lower control limits using a 3-sigma performance level and build your x-bar and R charts. Is the process in control?
 QUESTION:
Calculate the upper and lower control limits using a 3-sigma performance level and build your x-bar and R charts. Is the process in control? Why?
Draw both control charts. Show all your work.
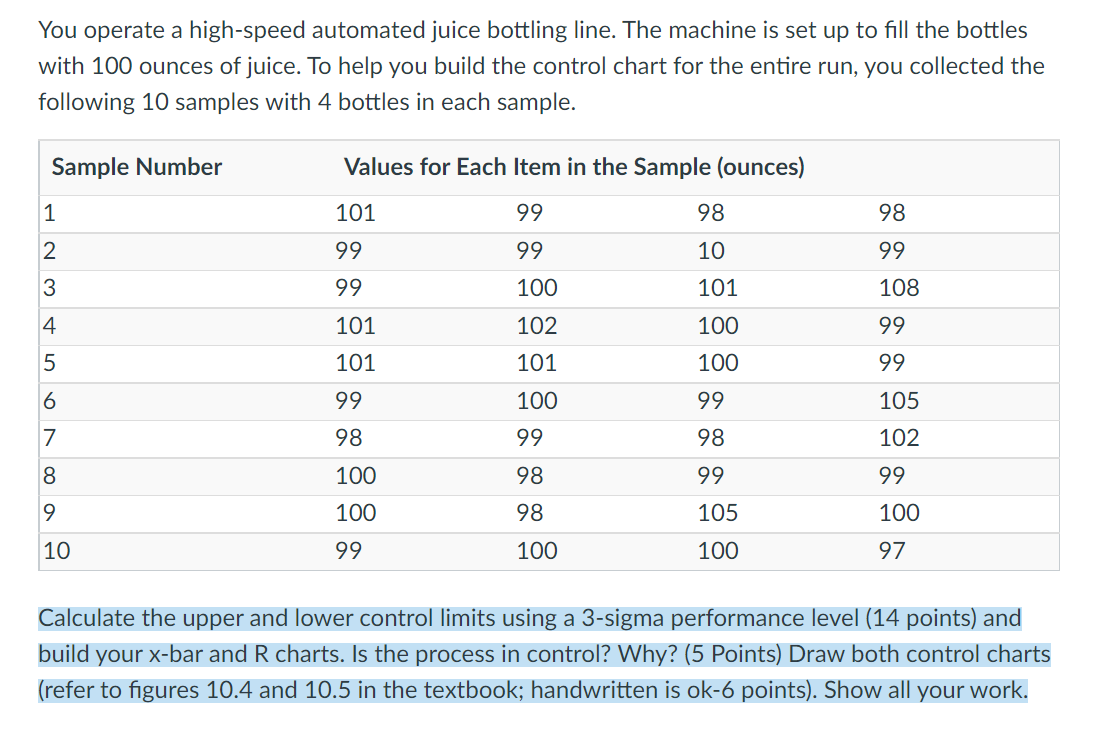
You operate a high-speed automated juice bottling line. The machine is set up to fill the bottles with 100 ounces of juice. To help you build the control chart for the entire run, you collected the following 10 samples with 4 bottles in each sample. Sample Number Values for Each Item in the Sample (ounces) 1 101 99 98 98 2 99 99 10 99 3 99 100 101 108 4 101 102 100 99 5 101 101 100 99 6 99 100 99 105 7 98 99 98 102 8 100 98 99 99 9 100 98 105 100 10 99 100 100 97 Calculate the upper and lower control limits using a 3-sigma performance level (14 points) and build your x-bar and R charts. Is the process in control? Why? (5 Points) Draw both control charts (refer to figures 10.4 and 10.5 in the textbook; handwritten is ok-6 points). Show all your work
Step by Step Solution
There are 3 Steps involved in it
1 Expert Approved Answer
Step: 1 Unlock

Question Has Been Solved by an Expert!
Get step-by-step solutions from verified subject matter experts
Step: 2 Unlock
Step: 3 Unlock