

Question: Question Completion Status: Which regression equation corresponds to the graph below? OPER 1401 - Regression Data Output 400 390 380 370 360 350 340 330
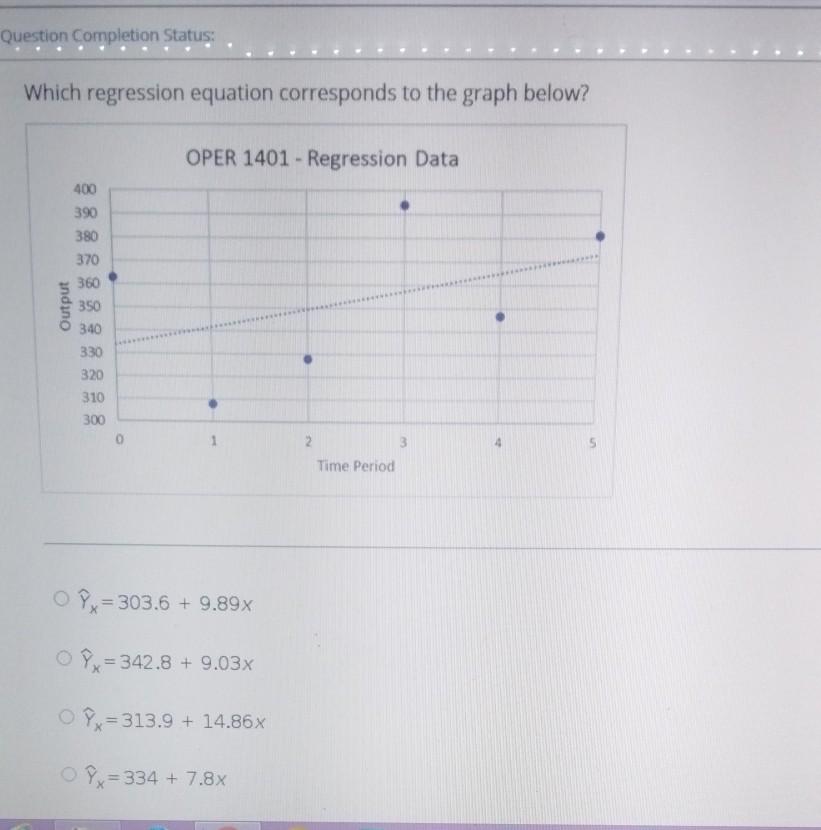
Question Completion Status: Which regression equation corresponds to the graph below? OPER 1401 - Regression Data Output 400 390 380 370 360 350 340 330 320 310 300 2 3 Time Period Yx=303.6 + 9.89% Yx= 342.8 + 9.03% O=313.9 + 14.86x Yx= 334 + 7.8%
Step by Step Solution
There are 3 Steps involved in it
1 Expert Approved Answer
Step: 1 Unlock

Question Has Been Solved by an Expert!
Get step-by-step solutions from verified subject matter experts
Step: 2 Unlock
Step: 3 Unlock