

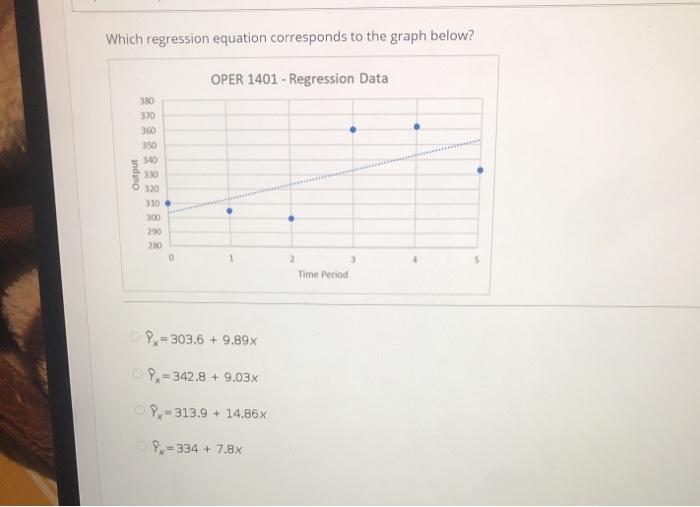
Question: Which regression equation corresponds to the graph below? OPER 1401 - Regression Data 380 320 360 350 5 340 O 330 310 300 200 2
Step by Step Solution
There are 3 Steps involved in it
1 Expert Approved Answer
Step: 1 Unlock

Question Has Been Solved by an Expert!
Get step-by-step solutions from verified subject matter experts
Step: 2 Unlock
Step: 3 Unlock