

Question: Question: Considering both the probability value and effect size measure, what interpretations would you make about the findings? That is, what are your conclusions about
Question:
Considering both the probability value and effect size measure, what interpretations would you make about the findings? That is, what are your conclusions about the effects of leaving happy faces on checks?
Recall again that Rind & Bordia (1996) investigated whether or not drawing a happy face on customers' checks increased the amount of tips received by a waitress at an upscale restaurant on a universitycampus. Duringthelunchhourawaitressdrewahappy,smilingfaceonthechecksofa randomhalfofhercustomers. Theremaininghalfofthecustomersreceivedacheckwithnodrawing(18 points).
The tip percentages for the control group (no happy face) are as follows:
45% 39% 36% 34% 34% 33% 31% 31% 30% 30% 28% 28% 28% 27% 27% 25% 23% 22% 21% 21% 20% 18% 8%
The tip percentages for the experimental group (happy face) are as follows:
72% 65% 47% 44% 41% 40% 34% 33% 33% 30% 29% 28% 27% 27% 25% 24% 24% 23% 22% 21% 21% 17%
Group of answer choices
The p value that is calculated for the t-test is dependent on several factors including sample size and effect size. It is very likely that, given the effect size obtained, if the sample size was larger the study would have yielded statistically significant results. Therefore, it appears that the low statistical power (i.e., high Type II error) of the study resulting from the small sample size was probably mainly responsible for the lack of significant findings.
The p value that is calculated for the t-test is dependent on one factor: sample size. It is very likely that, given the large effect size obtained, if the sample size was larger the study would have yielded statistically significant results. Therefore, it appears that the strong statistical power of the study resulting from the small sample size was mainly responsible for the lack of significant findings.
The p value that is calculated for the t-test is dependent on several factors including sample size and effect size. It is very likely that, given the small effect size obtained, if the sample size was smaller the study would have yielded statistically significant results. Therefore, it appears that the low statistical power (i.e., high Type II error) of the study resulting from the large sample size was mainly responsible for the lack of significant findings.
The p value that is calculated for the t-test is dependent on several factors including sample size and effect size. It is very likely that, given the effect size obtained, if the sample size was smaller the study would have yielded statistically significant results. Therefore, it appears that the low statistical power (i.e., high Type II error) of the study resulting from the large sample size was mainly responsible for the lack of significant findings.
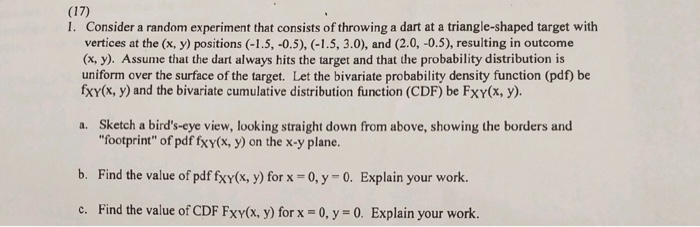
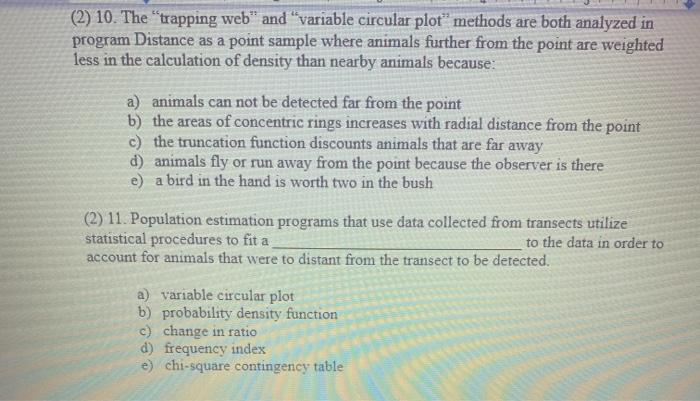
(17) 1. Consider a random experiment that consists of throwing a dart at a triangle-shaped target with vertices at the (x, y) positions (-1.5, -0.5), (-1.5, 3.0), and (2.0, -0.5), resulting in outcome (x, y). Assume that the dart always hits the target and that the probability distribution is uniform over the surface of the target. Let the bivariate probability density function (pdf) be fxY(x, y) and the bivariate cumulative distribution function (CDF) be FxY(x, y). a. Sketch a bird's-eye view, looking straight down from above, showing the borders and "footprint" of pdf fxy(x, y) on the x-y plane. b. Find the value of pdf fxY(x, y) for x = 0, y = 0. Explain your work. c. Find the value of CDF Fxv(x, y) for x = 0, y = 0. Explain your work.(2) 10. The "trapping web" and "variable circular plot" methods are both analyzed in program Distance as a point sample where animals further from the point are weighted less in the calculation of density than nearby animals because: a) animals can not be detected far from the point b) the areas of concentric rings increases with radial distance from the point c) the truncation function discounts animals that are far away animals fly or run away from the point because the observer is there e) a bird in the hand is worth two in the bush (2) 11. Population estimation programs that use data collected from transects utilize statistical procedures to fit a to the data in order to account for animals that were to distant from the transect to be detected a) variable circular plot b) probability density function c) change in ratio frequency index e) chi-square contingency table
Step by Step Solution
There are 3 Steps involved in it

Get step-by-step solutions from verified subject matter experts