

Question: Question: Considering both the probability value and effect size measure, what interpretations would you make about the findings? That is, what are your conclusions about
Question:
Considering both the probability value and effect size measure, what interpretations would you make about the findings? That is, what are your conclusions about the effects of leaving happy faces on checks?
Recall again that Rind & Bordia (1996) investigated whether or not drawing a happy face on customers' checks increased the amount of tips received by a waitress at an upscale restaurant on a universitycampus. Duringthelunchhourawaitressdrewahappy,smilingfaceonthechecksofa randomhalfofhercustomers. Theremaininghalfofthecustomersreceivedacheckwithnodrawing(18 points).
The tip percentages for the control group (no happy face) are as follows:
45% 39% 36% 34% 34% 33% 31% 31% 30% 30% 28% 28% 28% 27% 27% 25% 23% 22% 21% 21% 20% 18% 8%
The tip percentages for the experimental group (happy face) are as follows:
72% 65% 47% 44% 41% 40% 34% 33% 33% 30% 29% 28% 27% 27% 25% 24% 24% 23% 22% 21% 21% 17%
Group of answer choices
The p value that is calculated for the t-test is dependent on several factors including sample size and effect size. It is very likely that, given the effect size obtained, if the sample size was larger the study would have yielded statistically significant results. Therefore, it appears that the low statistical power (i.e., high Type II error) of the study resulting from the small sample size was probably mainly responsible for the lack of significant findings.
The p value that is calculated for the t-test is dependent on one factor: sample size. It is very likely that, given the large effect size obtained, if the sample size was larger the study would have yielded statistically significant results. Therefore, it appears that the strong statistical power of the study resulting from the small sample size was mainly responsible for the lack of significant findings.
The p value that is calculated for the t-test is dependent on several factors including sample size and effect size. It is very likely that, given the small effect size obtained, if the sample size was smaller the study would have yielded statistically significant results. Therefore, it appears that the low statistical power (i.e., high Type II error) of the study resulting from the large sample size was mainly responsible for the lack of significant findings.
The p value that is calculated for the t-test is dependent on several factors including sample size and effect size. It is very likely that, given the effect size obtained, if the sample size was smaller the study would have yielded statistically significant results. Therefore, it appears that the low statistical power (i.e., high Type II error) of the study resulting from the large sample size was mainly responsible for the lack of significant findings.
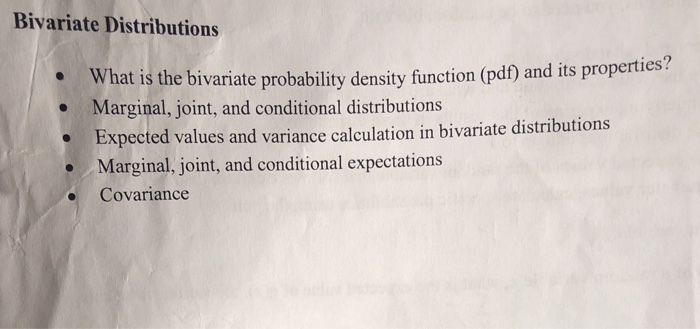
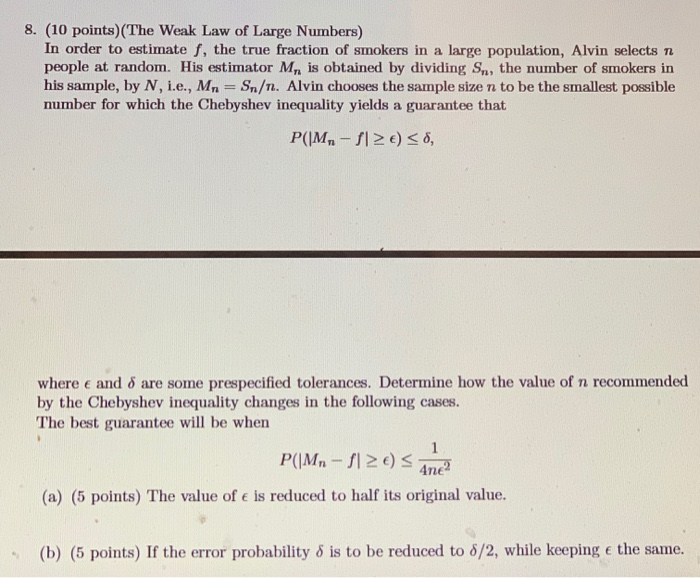
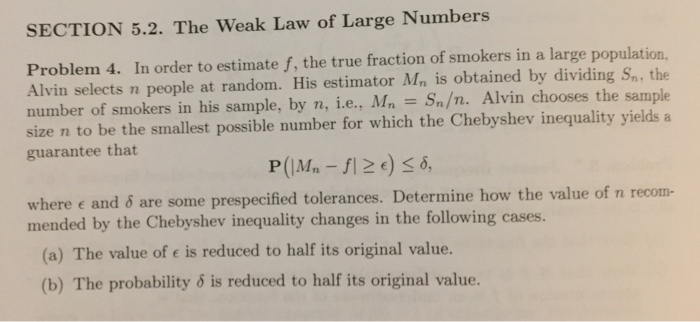
Bivariate Distributions What is the bivariate probability density function (pdf) and its properties? Marginal, joint, and conditional distributions Expected values and variance calculation in bivariate distributions Marginal, joint, and conditional expectations Covariance8. (10 points) (The Weak Law of Large Numbers) In order to estimate f, the true fraction of smokers in a large population, Alvin selects n people at random. His estimator M,, is obtained by dividing S, the number of smokers in his sample, by N, i.e., Mn = Sn. Alvin chooses the sample size n to be the smallest possible number for which the Chebyshev inequality yields a guarantee that P(IMn - 51 2 () 56, where e and o are some prespecified tolerances. Determine how the value of n recommended by the Chebyshev inequality changes in the following cases. The best guarantee will be when P(IMn - f1 2 () - Ane? (a) (5 points) The value of e is reduced to half its original value. (b) (5 points) If the error probability o is to be reduced to 6/2, while keeping e the same.SECTION 5.2. The Weak Law of Large Numbers Problem 4. In order to estimate f, the true fraction of smokers in a large population. Alvin selects n people at random. His estimator Mn is obtained by dividing Sn, the number of smokers in his sample, by n, i.e., Mn = Sn. Alvin chooses the sample size n to be the smallest possible number for which the Chebyshev inequality yields a guarantee that P(IMn - 1 Z E) 56, where e and o are some prespecified tolerances. Determine how the value of n recom- mended by the Chebyshev inequality changes in the following cases. (a) The value of e is reduced to half its original value. (b) The probability o is reduced to half its original value
Step by Step Solution
There are 3 Steps involved in it

Get step-by-step solutions from verified subject matter experts