

Question: Question: Considering both the probability value and effect size measure, what interpretations would you make about the findings? That is, what are your conclusions about

Question:
Considering both the probability value and effect size measure, what interpretations would you make about the findings? That is, what are your conclusions about the effects of leaving happy faces on checks?
Recall again that Rind & Bordia (1996) investigated whether or not drawing a happy face on customers' checks increased the amount of tips received by a waitress at an upscale restaurant on a universitycampus. Duringthelunchhourawaitressdrewahappy,smilingfaceonthechecksofa randomhalfofhercustomers. Theremaininghalfofthecustomersreceivedacheckwithnodrawing(18 points).
The tip percentages for the control group (no happy face) are as follows:
45% 39% 36% 34% 34% 33% 31% 31% 30% 30% 28% 28% 28% 27% 27% 25% 23% 22% 21% 21% 20% 18% 8%
The tip percentages for the experimental group (happy face) are as follows:
72% 65% 47% 44% 41% 40% 34% 33% 33% 30% 29% 28% 27% 27% 25% 24% 24% 23% 22% 21% 21% 17%
Group of answer choices
The p value that is calculated for the t-test is dependent on several factors including sample size and effect size. It is very likely that, given the effect size obtained, if the sample size was larger the study would have yielded statistically significant results. Therefore, it appears that the low statistical power (i.e., high Type II error) of the study resulting from the small sample size was probably mainly responsible for the lack of significant findings.
The p value that is calculated for the t-test is dependent on one factor: sample size. It is very likely that, given the large effect size obtained, if the sample size was larger the study would have yielded statistically significant results. Therefore, it appears that the strong statistical power of the study resulting from the small sample size was mainly responsible for the lack of significant findings.
The p value that is calculated for the t-test is dependent on several factors including sample size and effect size. It is very likely that, given the small effect size obtained, if the sample size was smaller the study would have yielded statistically significant results. Therefore, it appears that the low statistical power (i.e., high Type II error) of the study resulting from the large sample size was mainly responsible for the lack of significant findings.
The p value that is calculated for the t-test is dependent on several factors including sample size and effect size. It is
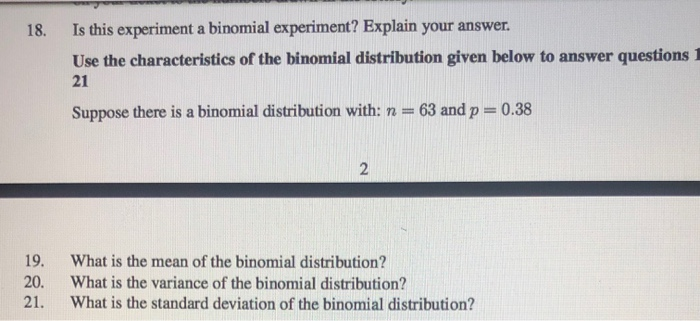
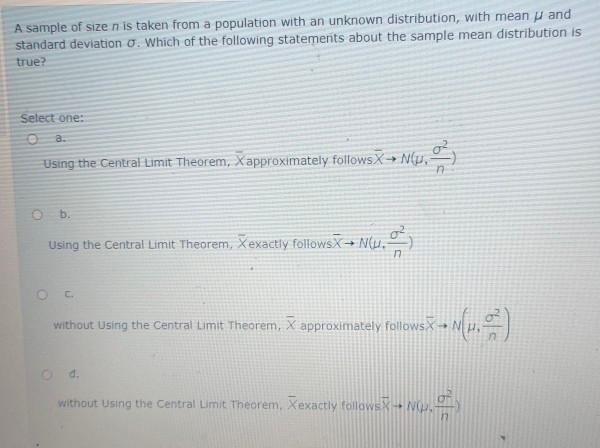
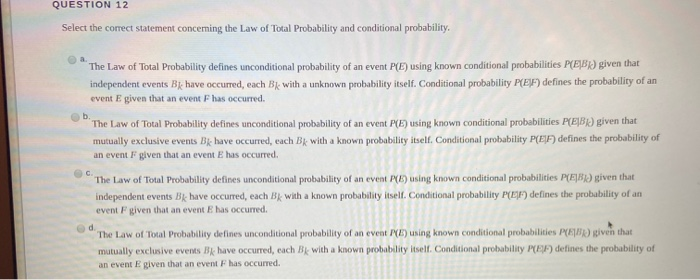

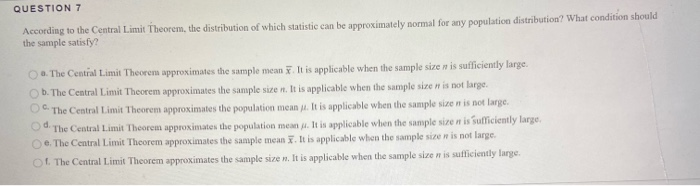
18. Is this experiment a binomial experiment? Explain your answer. Use the characteristics of the binomial distribution given below to answer questions 21 Suppose there is a binomial distribution with: n = 63 and p = 0.38 2 19. What is the mean of the binomial distribution? 20. What is the variance of the binomial distribution? 21. What is the standard deviation of the binomial distribution?A sample of size n is taken from a population with an unknown distribution, with mean u and standard deviation O. Which of the following statements about the sample mean distribution is true? Select one: 0 8. Using the Central Limit Theorem, X approximately follows X . Nu. b. Using the Central Limit Theorem, Xexactly followsx - Ntu. C. without Using the Central Limit Theorem, X approximately follows > . N p. =] 0 d Without Using the Central Limit Theorem, Xexactly follower . No.QUESTION 12 Select the comect statement concerning the Law of Total Probability and conditional probability. The Law of Total Probability defines unconditional probability of an event P(E) using known conditional probabilities P(BB) given that independent events Bk have occurred, each Bk with a unknown probability itself. Conditional probability P(E F) defines the probability of an event E given that an event F has occurred. Ob. The Law of Total Probability defines unconditional probability of an event P(E) using known conditional probabilities P(E B) given that mutually exclusive events B& have occurred, each BA with a known probability itself. Conditional probability P(E) ) defines the probability of an event F given that an event E has occurred. The Law of Total Probability defines unconditional probability of an event P(E) using known conditional probabilities P(E)By) given that independent events BA have occurred, each BK with a known probability itself. Conditional probability P(E F) defines the probability of an event F given that an event E has occurred. The Law of Total Probability defines unconditional probability of an event P(2) using known conditional probabilities P(FB) given that mutually exclusive events By have occurred, each By with a known probability itself. Conditional probability P(EA) defines the probability of an event E given that an event F has occurred.QUESTION 7 According to the Central Limit Theorem. the distribution of which statistic can be approximately normal for any population distribution? What condition should the sample satisfy? ). The Central Limit Theorem approximates the sample mean X. It is applicable when the sample size n is sufficiently large. Ob. The Central Limit Theorem approximates the sample size n. It is applicable when the sample size of is not large. The Central Limit Theorem approximates the population mean . It is applicable when the sample size n is not large. Of The Central Limit Theorem approximates the population mean a. It is applicable when the sample size or is sufficiently large, Ce, The Central Limit Theorem approximates the sample mean X. It is applicable when the sample size is is not large. OL. The Central Limit Theorem approximates the sample size n. It is applicable when the sample size or is sufficiently large
Step by Step Solution
There are 3 Steps involved in it

Get step-by-step solutions from verified subject matter experts