

Question: Question: Describe what each graph illustrates with the data. Question: Was the graphic selected appropriate for the data? Question: Any alternative graphics work better? Sum
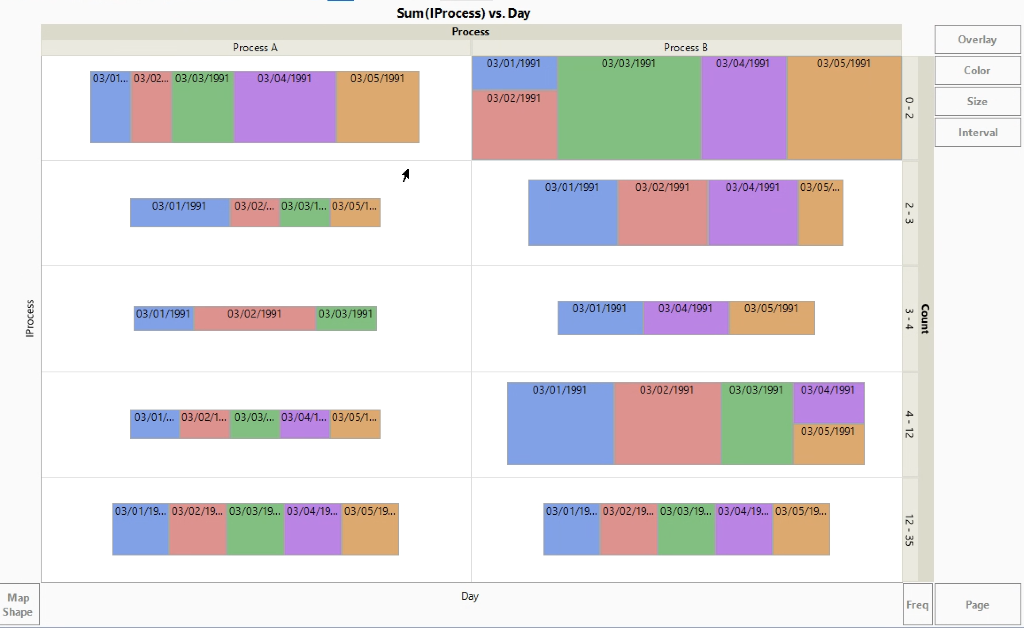
- Question: Describe what each graph illustrates with the data.
- Question: Was the graphic selected appropriate for the data?
- Question: Any alternative graphics work better?
Step by Step Solution
There are 3 Steps involved in it
1 Expert Approved Answer
Step: 1 Unlock

Question Has Been Solved by an Expert!
Get step-by-step solutions from verified subject matter experts
Step: 2 Unlock
Step: 3 Unlock