

Question: Question: Earned value management dashboard Based on the question 2 data, represent the projects earned value status in a visual format. Your image need only
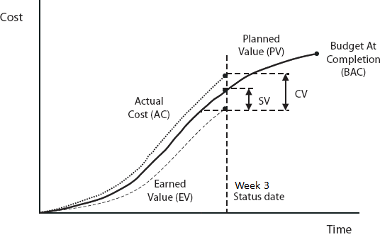
Question: Earned value management dashboard Based on the question 2 data, represent the projects earned value status in a visual format. Your image need only include your AC, EV, and PV over the four-week project (see example chart at right). This chart can be done in Excel (or equivalent), or it can be drawn by hand (and then digitally scanned or photographed, and included in your assignment).
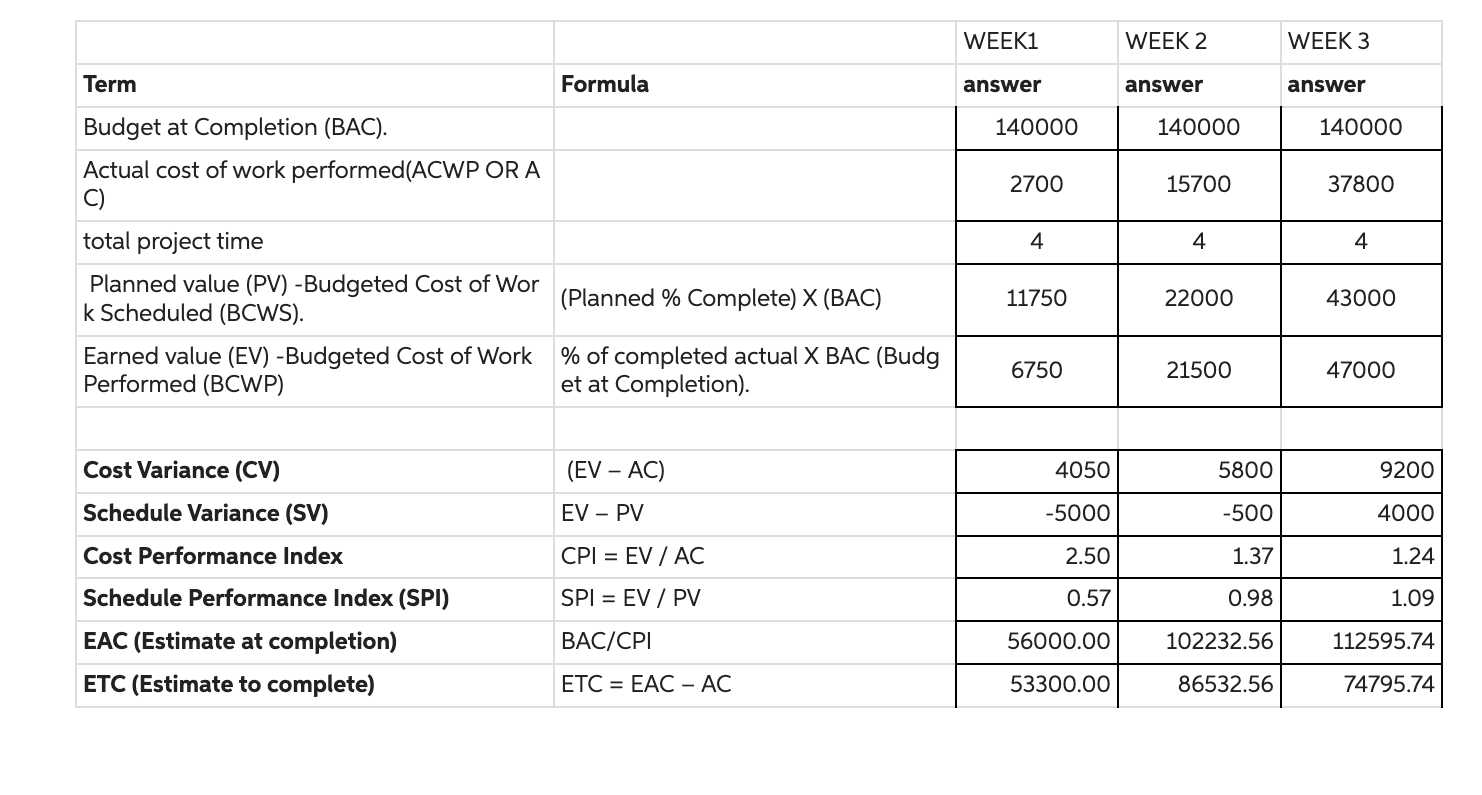
Question 2 Data
Step by Step Solution
There are 3 Steps involved in it
1 Expert Approved Answer
Step: 1 Unlock

Question Has Been Solved by an Expert!
Get step-by-step solutions from verified subject matter experts
Step: 2 Unlock
Step: 3 Unlock