

Question: Question: Earned value management dashboard Based on the question 2 data, represent the projects earned value status in a visual format. Your image need only
Question: Earned value management dashboard
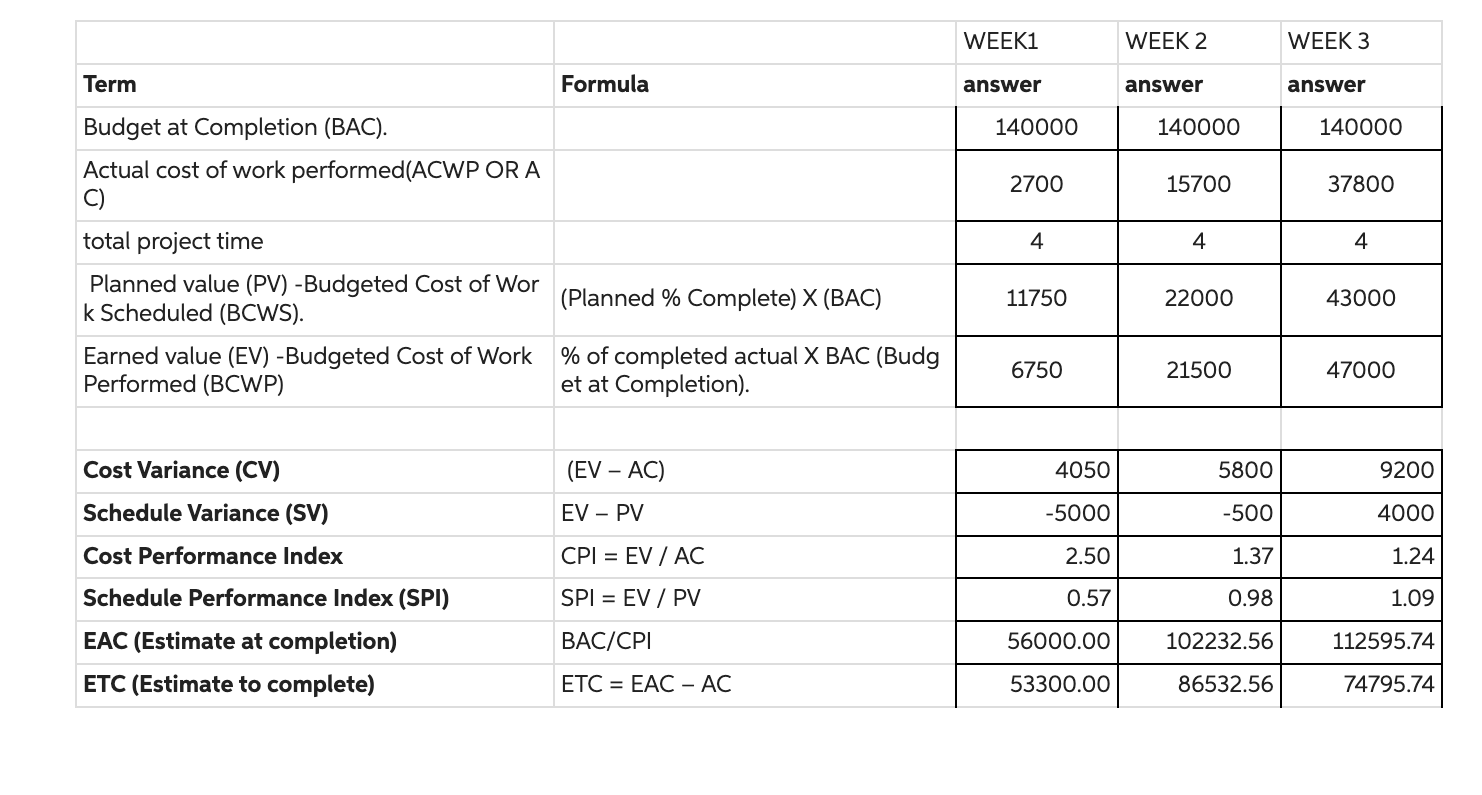
- Based on the question 2 data, represent the projects earned value status in a visual format.
- Your image need only include your AC, EV, and PV over the four-week project (see example chart at right).
- This chart can be done in Excel (or equivalent), or it can be drawn by hand (and then digitally scanned or photographed, and included in your assignment).
Question 2 Data
Step by Step Solution
There are 3 Steps involved in it
1 Expert Approved Answer
Step: 1 Unlock

Question Has Been Solved by an Expert!
Get step-by-step solutions from verified subject matter experts
Step: 2 Unlock
Step: 3 Unlock