

Question: QUESTION EIGHT a . In Fig. 2 is shown a plot of pump net head as a function of pump volume flow rate, or capacity.
QUESTION EIGHT
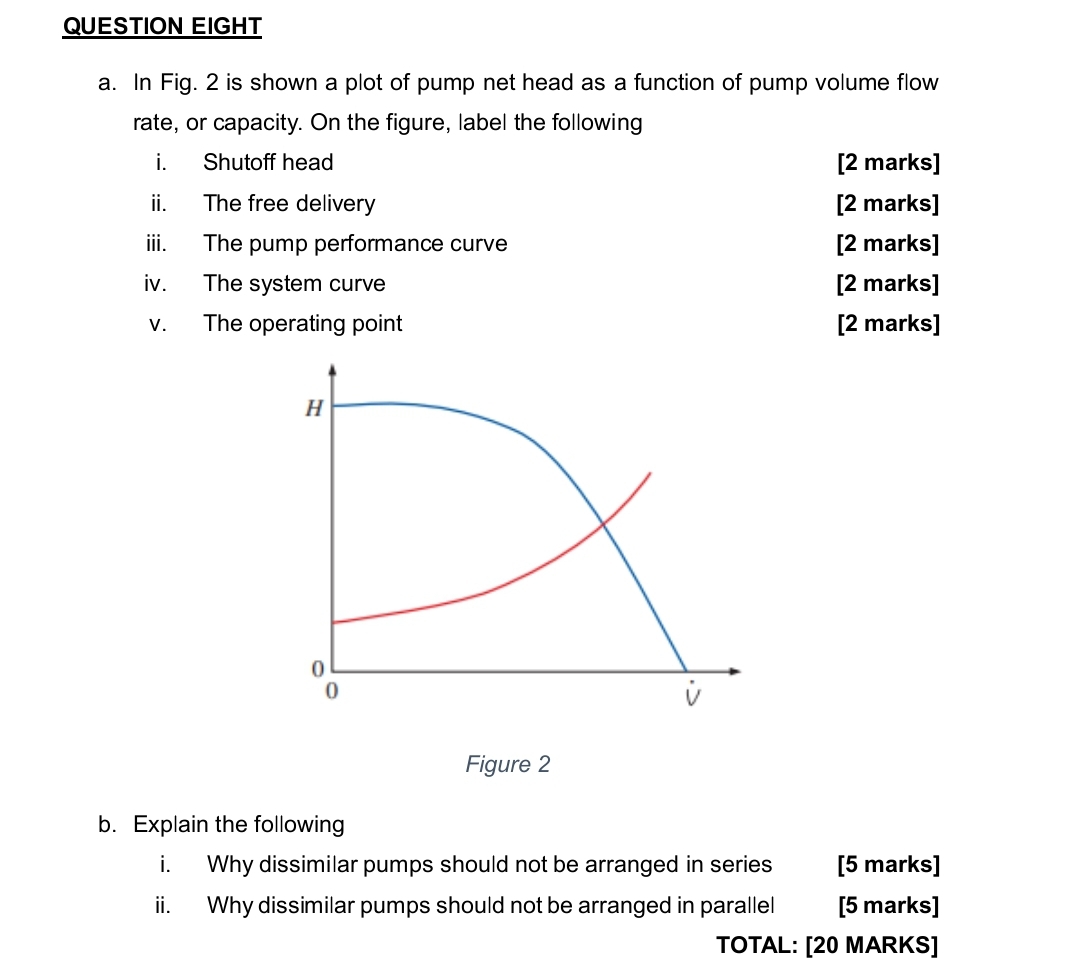
a In Fig. is shown a plot of pump net head as a function of pump volume flow rate, or capacity. On the figure, label the following
i Shutoff head
ii The free delivery
iii. The pump performance curve
iv The system curve
v The operating point
marks
marks
marks
marks
marks
Figure
b Explain the following
i Why dissimilar pumps should not be arranged in series
marks
ii Why dissimilar pumps should not be arranged in parallel
marks
TOTAL: MARKS
Step by Step Solution
There are 3 Steps involved in it
1 Expert Approved Answer
Step: 1 Unlock

Question Has Been Solved by an Expert!
Get step-by-step solutions from verified subject matter experts
Step: 2 Unlock
Step: 3 Unlock