

Question: In Fig. P1419C is shown a plot of pump net head as a function of pump volume flow rate, or capacity. On the figure, label
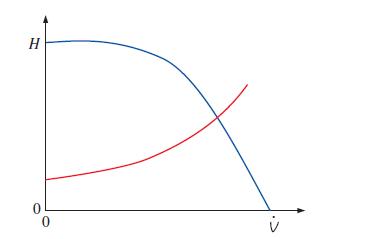
In Fig. P14–19C is shown a plot of pump net head as a function of pump volume flow rate, or capacity. On the figure, label the shutoff head, the free delivery, the pump performance curve, the system curve, and the operating point.
FIGURE P14–19C
H 0 0
Step by Step Solution
★★★★★
3.40 Rating (169 Votes )
There are 3 Steps involved in it
1 Expert Approved Answer
Step: 1 Unlock

Question Has Been Solved by an Expert!
Get step-by-step solutions from verified subject matter experts
Step: 2 Unlock
Step: 3 Unlock