

Question: Question: Explain the difference in interpretation between an observation falling below the lower control limit on a ichart and one falling below the lower control
Question:
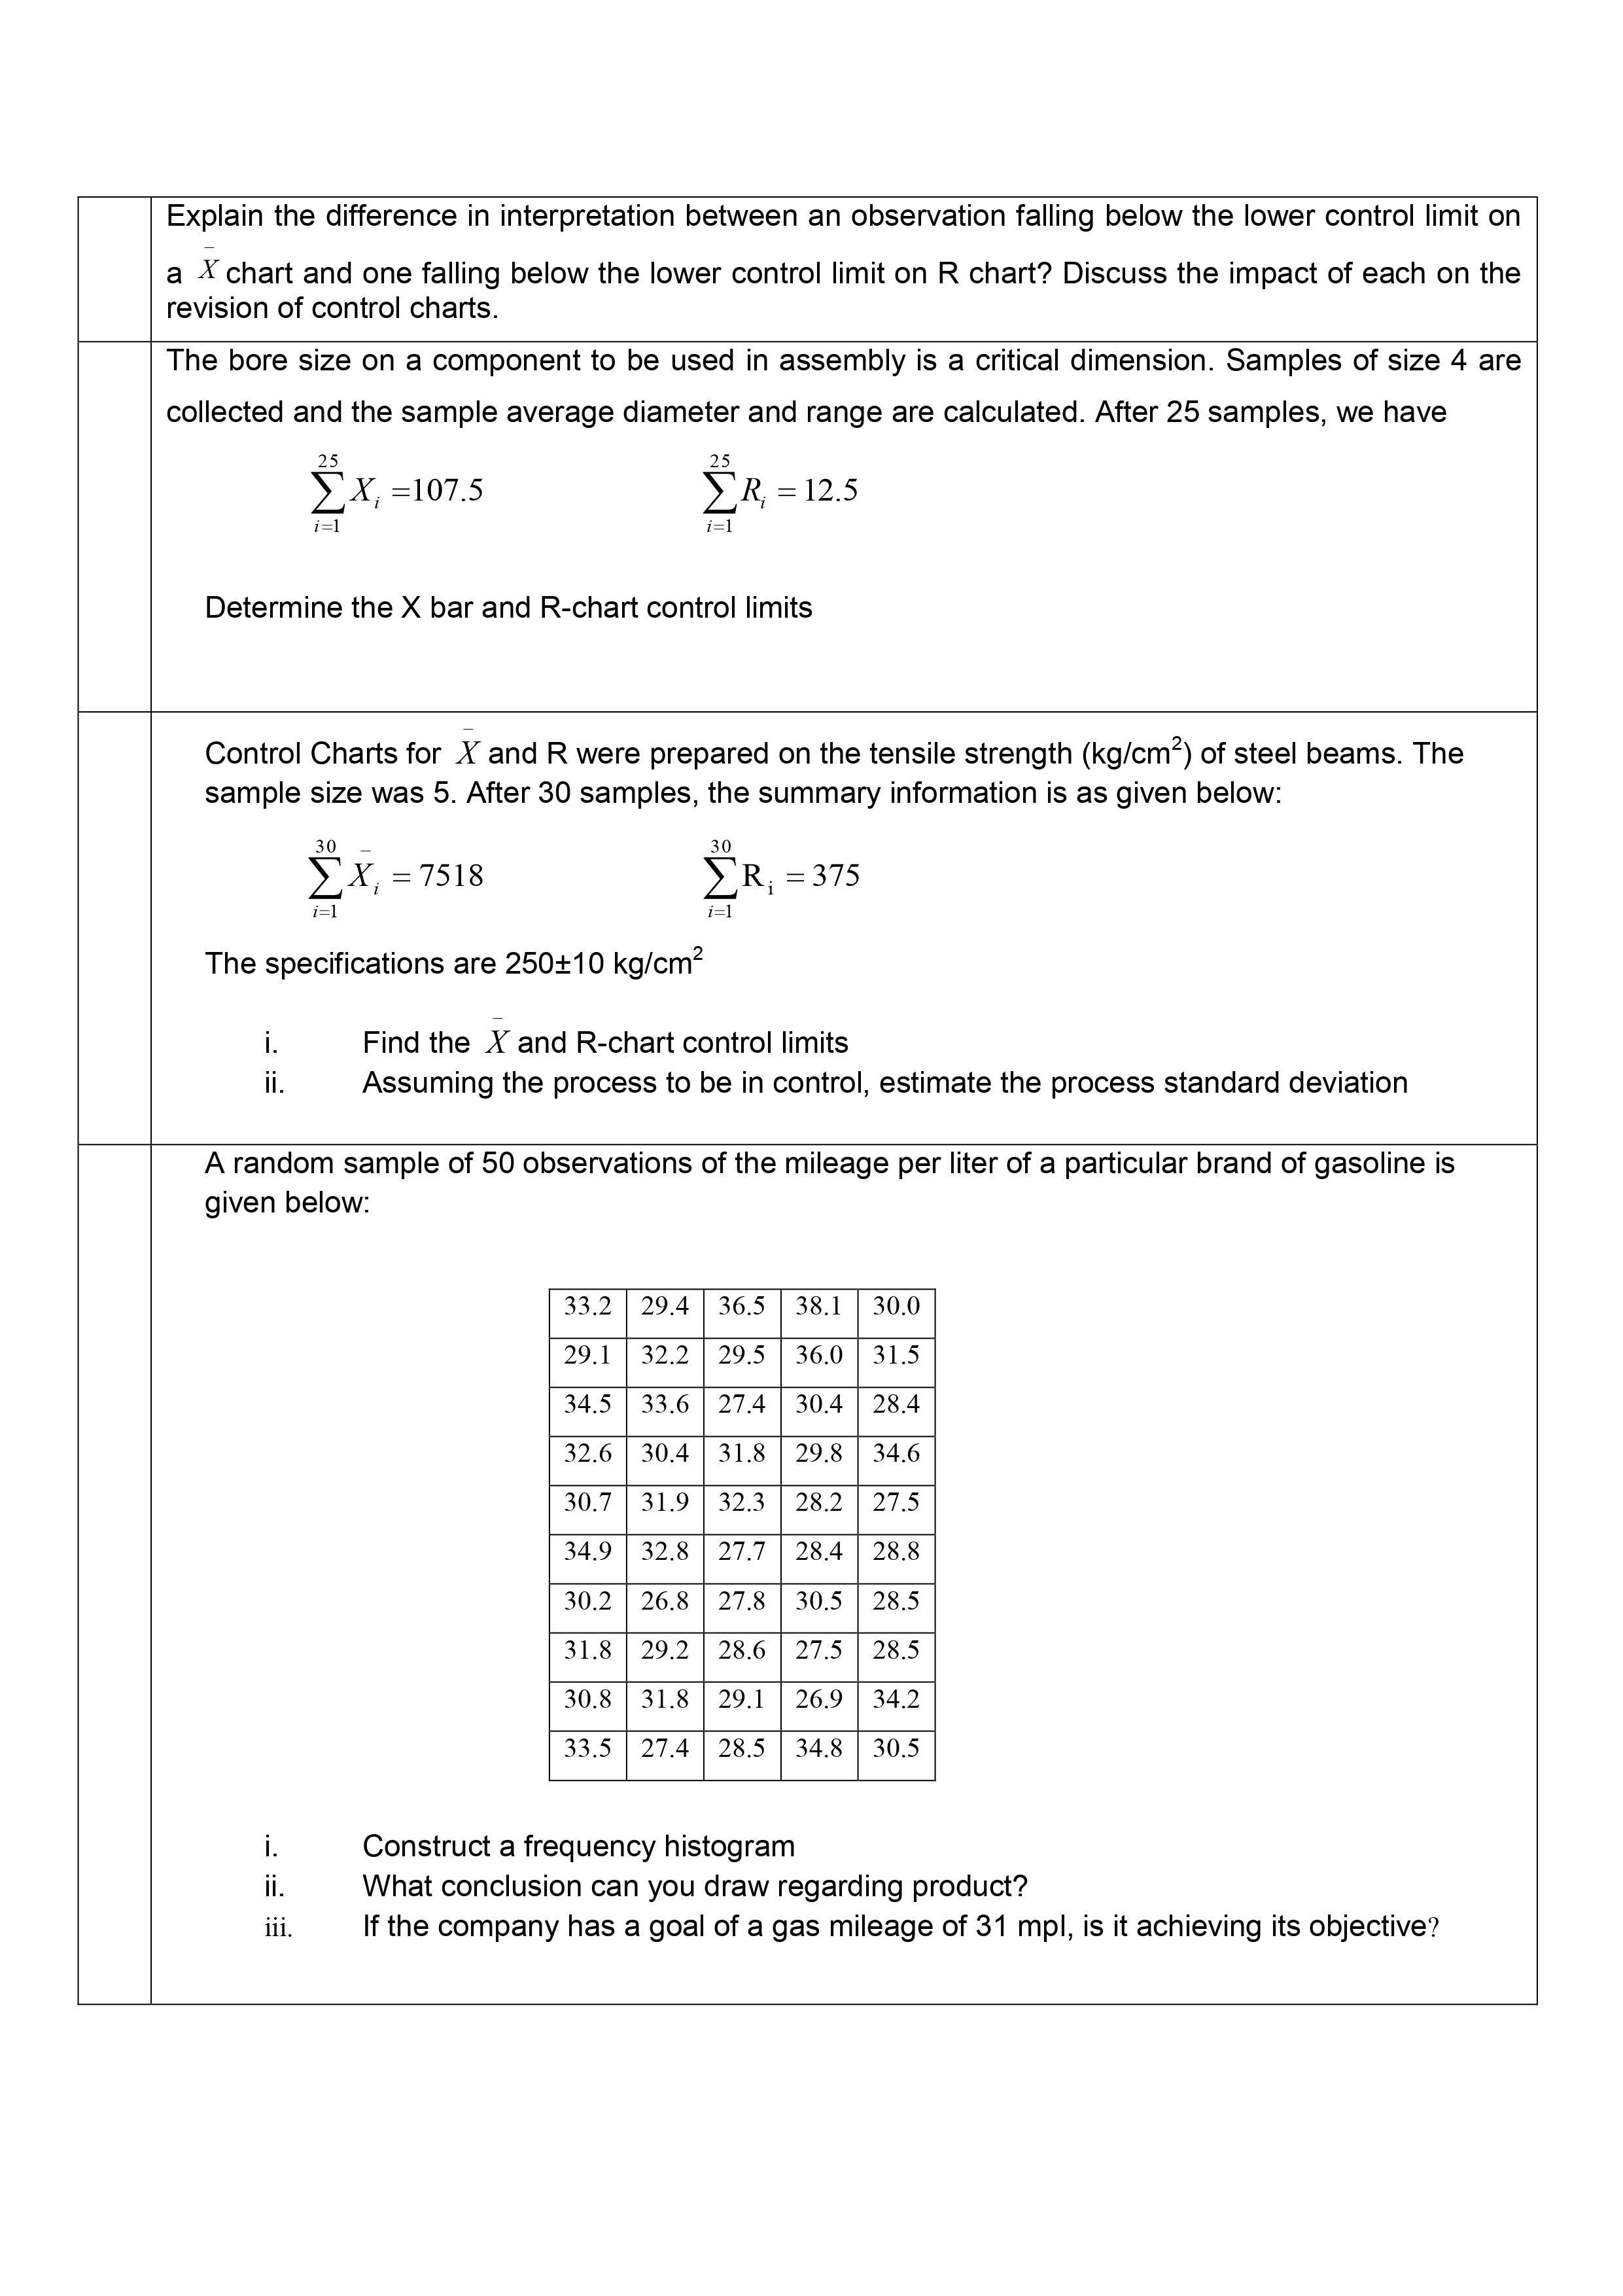
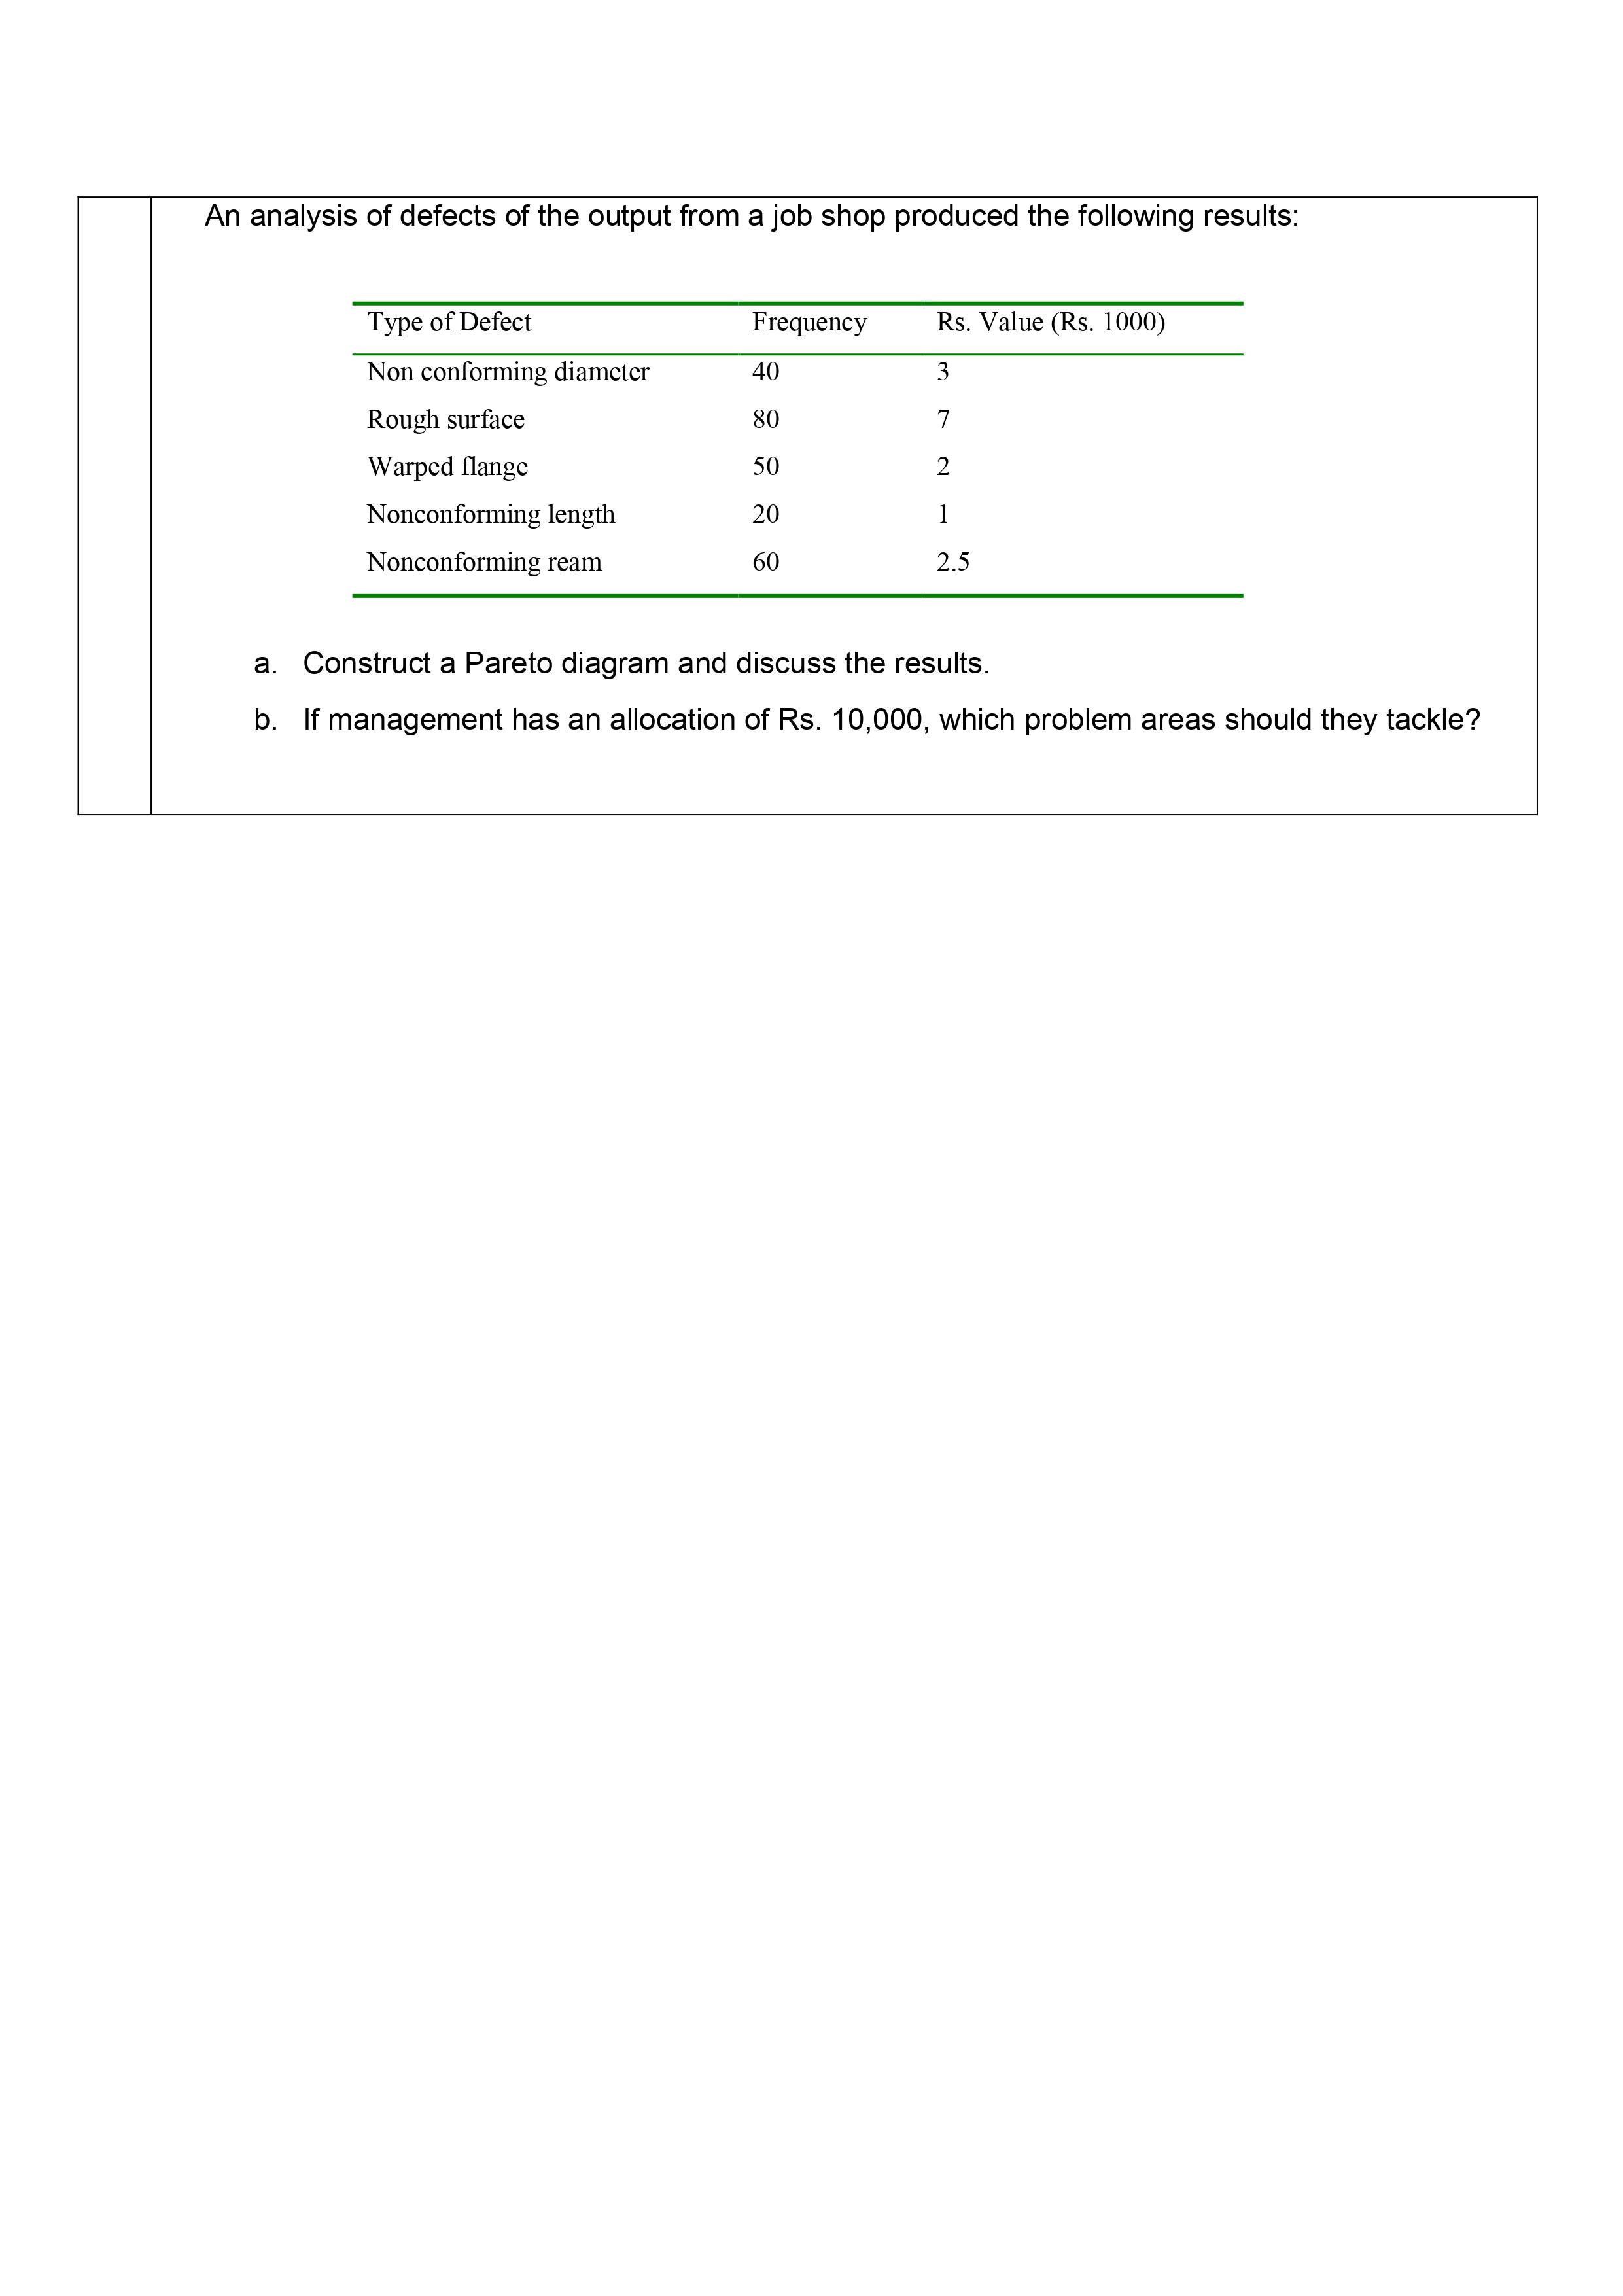
Explain the difference in interpretation between an observation falling below the lower control limit on a ichart and one falling below the lower control limit on R chart? Discuss the impact of each on the revision of control charts. The bore size on a component to be used in assembly is a critical dimension. Samples of size 4 are collected and the sample average diameter and range are calculated. After 25 samples, we have 2X. =107.5 ER. = 12.5 1'71 Determine the X bar and Rchart control limits Control Charts for )7{ and R were prepared on the tensile strength (kg/cmz) of steel beams. The sample size was 5. After 30 samples, the summary information is as given below: 30 30 2X1. =7518 ZRi =375 1:1 H The specifications are 250:10 kg/cm2 i. Find the )1 and Rchart control limits ii. Assuming the process to be in control, estimate the process standard deviation A random sample of 50 observations of the mileage per liter of a particular brand of gasoline is given below: 33.2 29.4 36.5 38.1 30.0 29.1 32.2 29.5 36.0 31.5 34.5 33.6 27,4 30.4 28.4 32.6 30.4 31.8 29.8 34.6 27.5 28.8 28.5 28.5 34.2 33.5 27.4 28.5 34.8 30.5 30.7 31.9 32.3 28.2 34.9 32.8 27.7 28.4 30.2 26.8 27.8 30.5 31.8 29.2 28.6 27.5 30.8 31.8 29.1 26.9 i. Construct a frequency histogram ii. What conclusion can you draw regarding product? iii. If the company has a goal of a gas mileage of 31 mpl, is it achieving its objective? An analysis of defects of the output from a job shop produced the following results: Type of Defect Frequency Rs. Value (Rs. 1000) Non conforming diameter 40 Rough surface 80 Warped flange 50 Nonconforming length 20 1 Nonconforming ream 60 2.5 a. Construct a Pareto diagram and discuss the results b. If management has an allocation of Rs. 10,000, which problem areas should they tackle?An analysis of defects of the output from a job shop produced the following results: Type of Defect Frequency Rs. Value (Rs. 1000) Non conforming diameter 40 Rough surface 80 Warped flange 50 Nonconforming length 20 1 Nonconforming ream 60 2.5 a. Construct a Pareto diagram and discuss the results b. If management has an allocation of Rs. 10,000, which problem areas should they tackle
Step by Step Solution
There are 3 Steps involved in it

Get step-by-step solutions from verified subject matter experts