

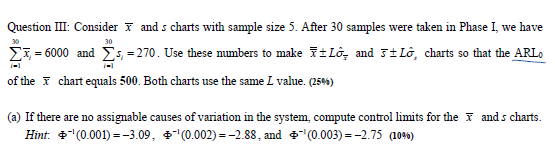
Question: Question III: Consider x and s charts with sample size 5 . After 3 0 samples were taken in Phase I, we have i =
Question III: Consider and charts with sample size After samples were taken in Phase I, we have
and Use these numbers to make Lhat and Lhat charts so that the ARL
of the chart equals Both charts use the same value.
a If there are no assignable causes of variation in the system, compute control limits for the and charts.
Hint: and
Step by Step Solution
There are 3 Steps involved in it
1 Expert Approved Answer
Step: 1 Unlock

Question Has Been Solved by an Expert!
Get step-by-step solutions from verified subject matter experts
Step: 2 Unlock
Step: 3 Unlock