

Question: *Question involves MATLAB 2) 10 pts To get a feel for how, qualitatively, viscosities can vary with solids fraction, suppose you performed viscosity measurements on
*Question involves MATLAB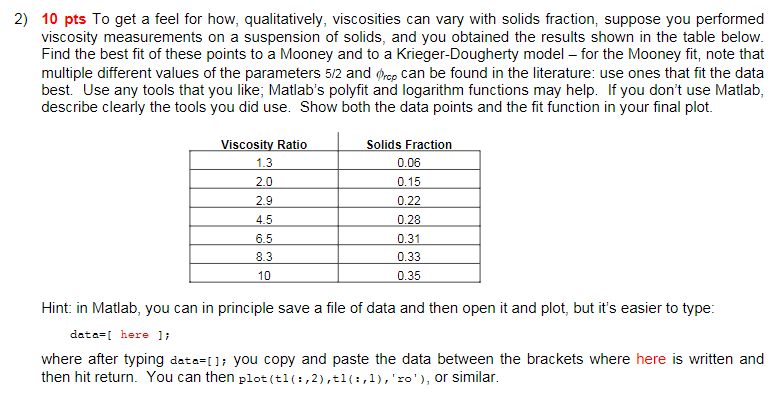
2) 10 pts To get a feel for how, qualitatively, viscosities can vary with solids fraction, suppose you performed viscosity measurements on a suspension of solids, and you obtained the results shown in the table below. Find the best fit of these points to a Mooney and to a Krieger-Dougherty model - for the Mooney fit, note that multiple different values of the parameters 5/2 and Orcp can be found in the literature: use ones that fit the data best. Use any tools that you like; Matlab's polyfit and logarithm functions may help. If you don't use Matlab, describe clearly the tools you did use. Show both the data points and the fit function in your final plot. Viscosity Ratio 1.3 Solids Fraction 0.06 0.15 0.22 2.0 0.28 2.9 4.5 6.5 8.3 0.31 0.33 0.35 10 Hint: in Matlab, you can in principle save a file of data and then open it and plot, but it's easier to type: data=[ here li where after typing data=0); you copy and paste the data between the brackets where here is written and then hit return. You can then plot(t1(:,2), t1(:,1), 'ro'), or similar. 2) 10 pts To get a feel for how, qualitatively, viscosities can vary with solids fraction, suppose you performed viscosity measurements on a suspension of solids, and you obtained the results shown in the table below. Find the best fit of these points to a Mooney and to a Krieger-Dougherty model - for the Mooney fit, note that multiple different values of the parameters 5/2 and Orcp can be found in the literature: use ones that fit the data best. Use any tools that you like; Matlab's polyfit and logarithm functions may help. If you don't use Matlab, describe clearly the tools you did use. Show both the data points and the fit function in your final plot. Viscosity Ratio 1.3 Solids Fraction 0.06 0.15 0.22 2.0 0.28 2.9 4.5 6.5 8.3 0.31 0.33 0.35 10 Hint: in Matlab, you can in principle save a file of data and then open it and plot, but it's easier to type: data=[ here li where after typing data=0); you copy and paste the data between the brackets where here is written and then hit return. You can then plot(t1(:,2), t1(:,1), 'ro'), or similar
Step by Step Solution
There are 3 Steps involved in it

Get step-by-step solutions from verified subject matter experts