

Question: Question The graph of an exponential function is shown below as a solid blue curve and its asymptote is drawn as a red dotted line.
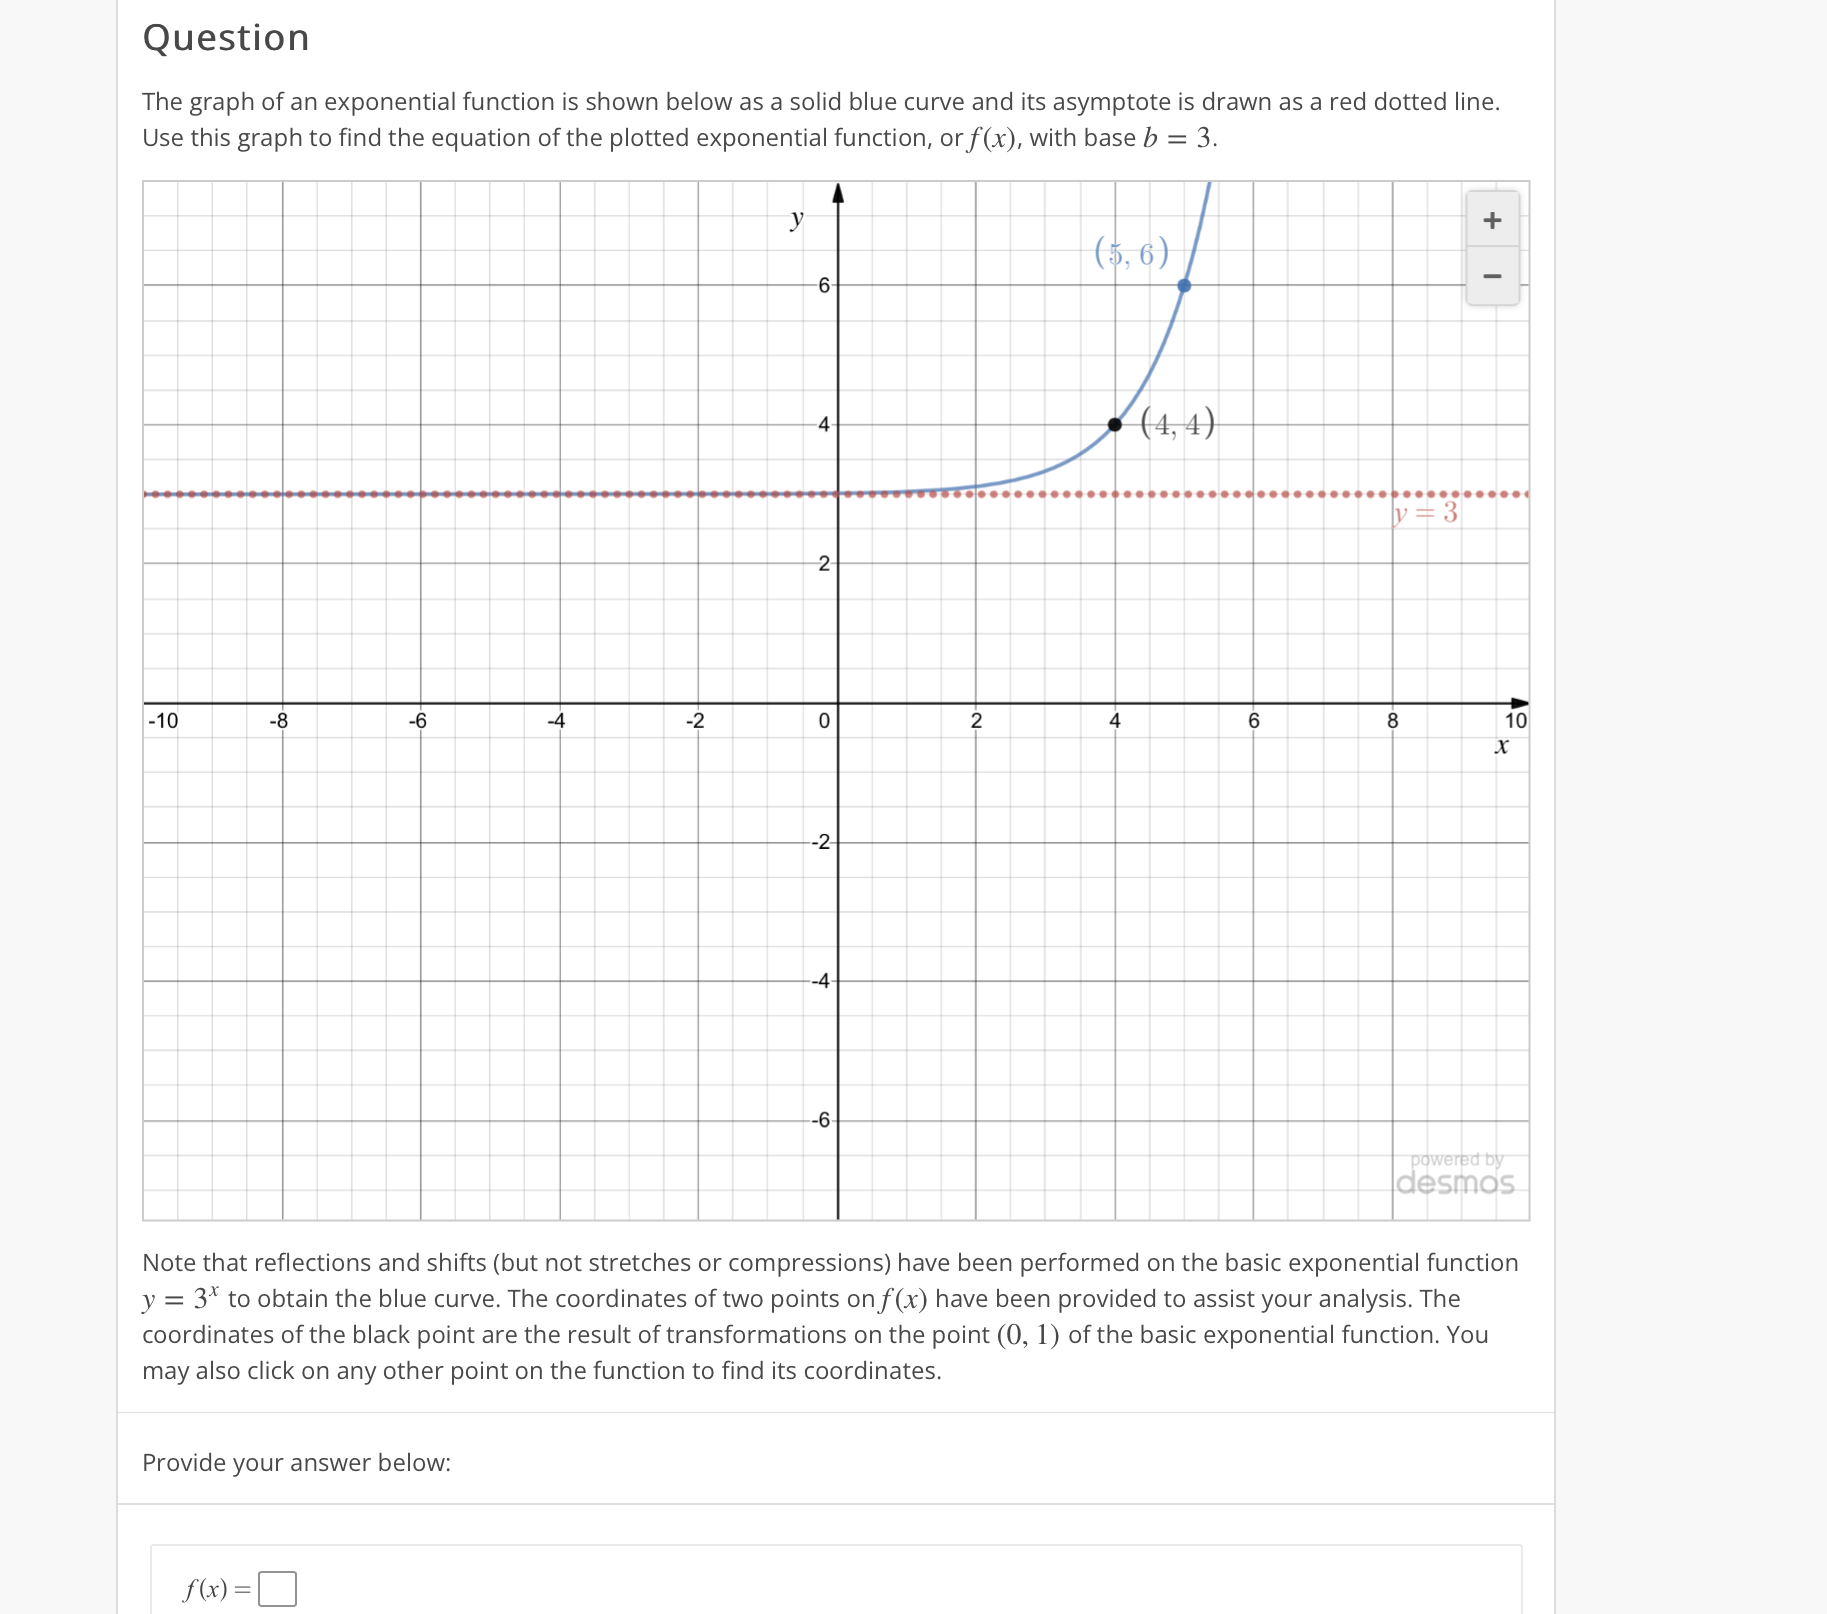
Question The graph of an exponential function is shown below as a solid blue curve and its asymptote is drawn as a red dotted line. Use this graph to find the equation of the plotted exponential function, or f(x), with base b = 3. y + ($, 6) -4- . ( 4, 4 ) russo. . ......... V =3 N -10 -8 -6 -4 -2 0 2 4 6 8 10 1-2 --4- -6- powered by desmos Note that reflections and shifts (but not stretches or compressions) have been performed on the basic exponential function y = 3" to obtain the blue curve. The coordinates of two points on f(x) have been provided to assist your analysis. The coordinates of the black point are the result of transformations on the point (0, 1) of the basic exponential function. You may also click on any other point on the function to find its coordinates. Provide your answer below: f (x) =]
Step by Step Solution
There are 3 Steps involved in it

Get step-by-step solutions from verified subject matter experts