

Question: What statistical analysis I should use considering the small sample size (n=5 vs. n=5), and the fact that I have multiple biopsies from each subject?
What statistical analysis I should use considering the small sample size (n=5 vs. n=5), and the fact that I have multiple biopsies from each subject?
Study:
Subjects (two independent groups):
- human femoral heads (cadavers, healthy, n = 5; subjects 1-5), used here as the control group
- human femoral heads (cadavers, arthritic/pathological, n = 5; subjects 6-10).
- I extracted 43 biopsies from each healthy subject for analysis (in total, 5 x 43 = 215 biopsies). These biopsies cover the entire surface of the femoral head, and are assigned to three different regions.
- These three regions are:
- load-bearing region = LBR
- non-load-bearing-region = NLBR
- peripheral rim = PR
- I also extracted 116 biopsies from arthritic/pathological subjects (LBR, n=11; NLBR, n=73; and PR, n=32).
Study hypothesis: different groups/health-states (i.e. healthy vs. pathological) have different bone porosity metrics (dependent variables) in different regions of the femoral head.
In other words, I want to see the differences not only between the healthy and pathological groups but also between different regions of the joint. The boxplot of a dependent variable (Feret: maximum porosity size) is provided below as an example.
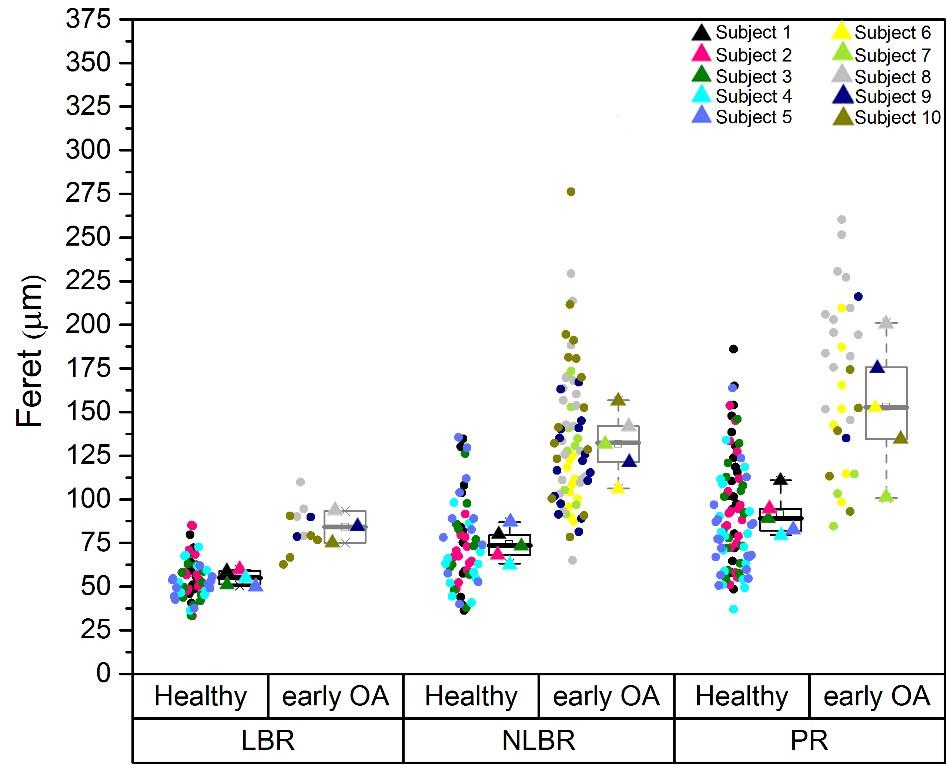
Fig. 1. The changes of one of the dependent variables (i.e. Feret) in three different loading areas of the joint (i.e. LBR, NLBR, PR), as well as healthy and pathological (early OA) groups. Each circle adjacent to the boxplots represents the mean value of a biopsy and is color-coded to its corresponding subject. The filled triangles signify the mean values of corresponding subjects in each loading region.
Feret (um) 375 350 325 300 275 250 225 200 175 150 125 100 75 50 25 0 Subject 1 Subject 2 Subject 3 Subject 4 Subject 5 O Subject 6 Subject 7 Subject 8 Subject 9 Subject 10 Healthy early OA Healthy early OA| Healthy early OA LBR NLBR PR
Step by Step Solution
3.51 Rating (168 Votes )
There are 3 Steps involved in it
statistical analysis The science of collecting exploring and presenting large amounts of data to discover underlying patterns and trends statistics are applied every day in research industry and gover... View full answer

Get step-by-step solutions from verified subject matter experts