

Question: QUESTIONS: 1. The temperature interval diagram for a process is shown below. For this process, do the following: Stream 1 2 3 4 5 6
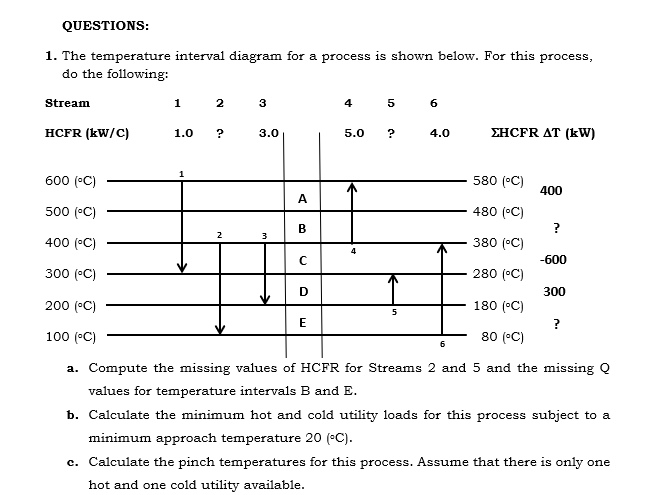
QUESTIONS: 1. The temperature interval diagram for a process is shown below. For this process, do the following: Stream 1 2 3 4 5 6 HCFR (kW/C) 1.0 ? 3.0 5.0 ? 4.0 EHCFR AT (kW) 1 600 (C) 580 (C) 400 D A 500 (C) 480 (C) B ? 2 3 400 (C) 380 (C) 4 -600 300 (C) 280 (C) D 300 200 (C) 180 (C) 5 E ? 100(C) 80 (C) 6 a. Compute the missing values of HCFR for Streams 2 and 5 and the missing Q values for temperature intervals B and E. b. Calculate the minimum hot and cold utility loads for this process subject to a minimum approach temperature 20 (C). c. Calculate the pinch temperatures for this process. Assume that there is only one hot and one cold utility available
Step by Step Solution
There are 3 Steps involved in it

Get step-by-step solutions from verified subject matter experts