

Question: Questions: A. Distinguish between Sunbest orange juice demand function and Sunbest orange juice demand curve? B. What is the difference between a change in the
Questions:
A.Distinguish between Sunbest orange juice demand function and Sunbest orange juice demand curve?
B.What is the difference between a change in the quantity demanded and a shift in the demand curve for this company?
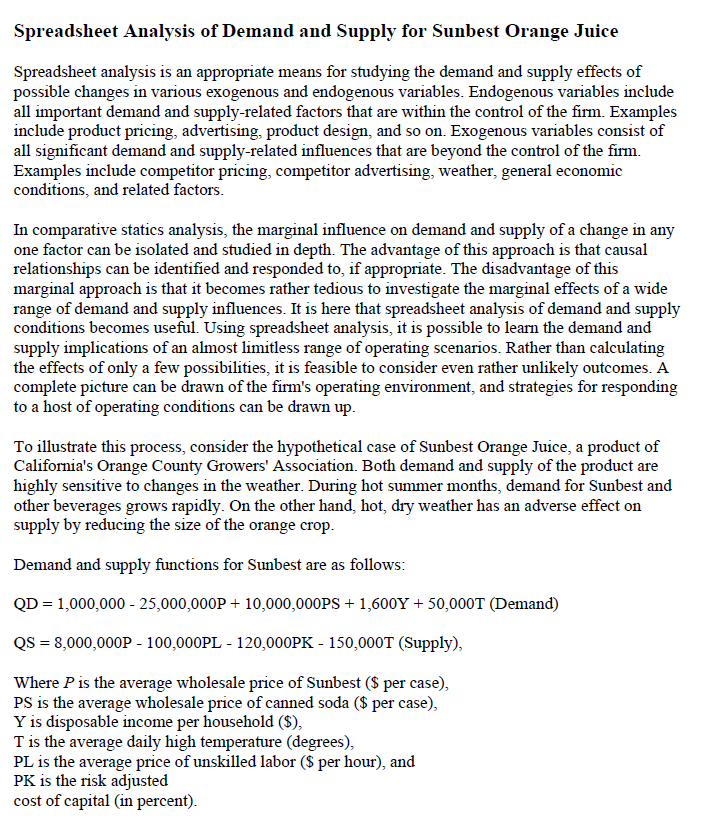
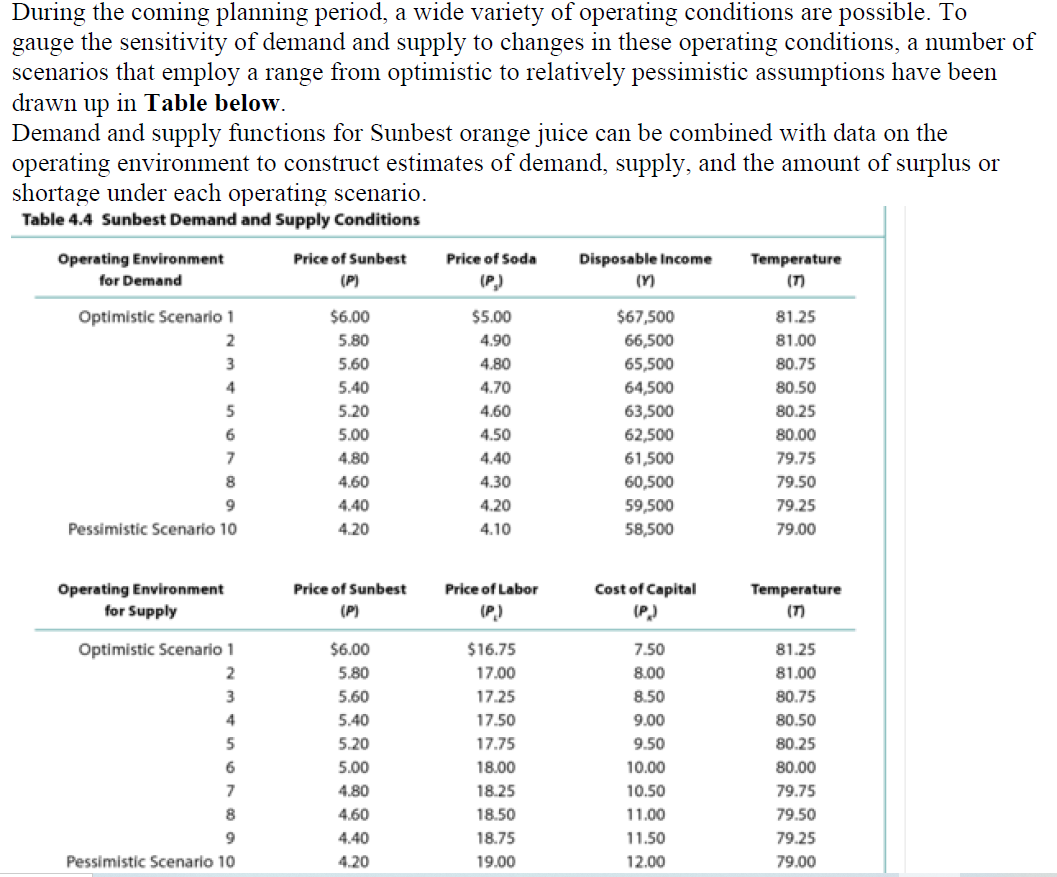
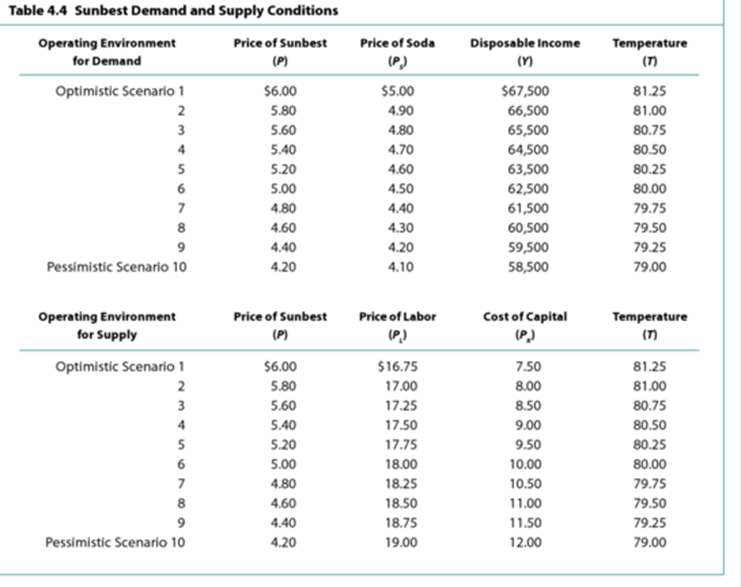
Spreadsheet Analysis of Demand and Supply for Sunbest Orange Juice Spreadsheet analysis is an appropriate means for studying the demand and supply e'ects of possible changes in various exogenous and endogenous variables. Endogenous variables include all important demand and supplyrelated factors that are within the control of the rm. Examples include product pricing, advertising, product design, and so on. Exogenous variables consist of all signicant demand and supplyrelated inuences that are beyond the control of the rm. Examples include competitor pricing, competitor advertising, weather, general economic conditions, and related factors. In comparative statics analysis, the marginal inuence on demand and supply of a change in any one factor can be isolated and studied in depth. The advantage of this approach is that causal relationships can be identied and responded to, if appropriate. The disadvantage of this marginal approach is that it becomes rather tedious to investigate the marginal effects of a wide range of demand and supply inuences. It is here that spreadsheet analysis of demand and supply conditions becomes useful. Using spreadsheet analysis, it is possible to learn the demand and supply implications of an almost limitless range of operating scenarios- Rather than calculating the effects of only a few possibilities, it is feasible to consider even rather unlikely outcomes. A complete picture can be drawn of the rm's operating environment, and strategies for responding to a host of operating conditions can be drawn up. To illustrate this process, consider the hypothetical case of Sunbest Orange Juice, a product of l[lalit'ornia's Orange County Growers' Association. Both demand and supply of the product are highly sensitive to changes in the weather. During hot summer months, demand for Sunbest and other beverages grows rapidly. On the other hand, hot, dry weather has an adverse e'ect on supply by reducing the size of the orange crop. Demand and supply mctions for Sunbest are as follows: QD = 1,000,000 25,000,000]? + 10,000,000PS + 1,600Y + 50,000T (Demand) QS = someone _ 100,000PL _ 120,000PK 150,000T (Supply), Where P is the average wholesale price of Sunbest ($ per case), PS is the average wholesale price of canned soda ($ per case), Y is disposable income per household (3), T is the average daily high temperature (degrees), PL is the average price of unskilled labor (3 per hour), and PK is the risk adjusted cost of capital (in percent). During the coming planning period, a wide variety of operating conditions are possible. To gauge the sensitivity of demand and supply to changes in these operating conditions, a number of scenarios that employ a range from optimistic to relatively pessimistic assumptions have been drawn up in Table below. Demand and supply functions for Sunbest orange juice can be combined with data on the operating environment to construct estimates of demand, supply, and the amount of surplus or shortage under each operating scenario. Table 4.4 Sunbest Demand and Supply Conditions Operating Environment Price of Sunbest Price of Soda Disposable Income Temperature for Demand (P) (P.) (Y) (T) Optimistic Scenario 1 $6.00 $5.00 $67,500 81.25 & WN 5.80 4.90 66,500 81.00 5.60 4.80 65,500 80.75 un 5.40 4.70 64,500 80.50 5.20 4.60 63,500 80.25 6 5.00 4.50 62.500 80.00 7 4.80 4.40 61,500 79.75 4.60 4.30 60,500 79.50 4.40 4.20 59,500 79.25 Pessimistic Scenario 10 4.20 4.10 58,500 79.00 Operating Environment Price of Sunbest Price of Labor Cost of Capital Temperature for Supply (P) (P) (P ) (T) Optimistic Scenario 1 $6.00 $16.75 7.50 81.25 W N 5.80 17.00 8.00 81.00 5.60 17.25 8.50 80.75 5.40 17.50 9.00 80.50 5.20 17.75 9.50 80.25 5.00 18.00 10.00 80.00 4.80 18.25 10.50 79.75 4.60 18.50 11.00 79.50 4.40 18.75 11.50 79.25 Pessimistic Scenario 10 4.20 19.00 12.00 79.00Table 4.4 Sunbest Demand and Supply Conditions Operating Environment Price of Sunbest Price of Soda Disposable Income Temperature for Demand (P) (P.) (n) (7) Optimistic Scenario 1 $6.00 $5.00 $67,500 81.25 W N 5.80 4.90 66,500 81.00 5.60 4.80 65,500 80.75 5.40 4.70 64,500 80.50 5.20 4.60 63,500 80.25 5.00 4.50 62,500 80.00 4.80 4.40 61,500 79.75 Pessimistic Scenario 10 1 00 4.60 4.30 60,500 79.50 4.40 4.20 59,500 79.25 4.20 4.10 58,500 79.00 Operating Environment Price of Sunbest Price of Labor Cost of Capital Temperature for Supply (P) (P) (P ) (T) Optimistic Scenario 1 $6.00 $16.75 7.50 81.25 W N 5.80 17.00 8.00 81.00 5.60 17.25 8.50 80.75 A 5.40 17.50 9.00 80.50 5.20 17.75 9.50 80.25 5.00 18.00 10.00 80.00 4.80 18.25 10.50 79.75 4.60 18.50 11.00 79.50 4.40 18.75 11.50 79.25 Pessimistic Scenario 10 4.20 19.00 12.00 79.00
Step by Step Solution
There are 3 Steps involved in it

Get step-by-step solutions from verified subject matter experts