

Question: r9 pts) You are analyzing two mutually exclusive projects, S and I, whose cash flows (end-of-year) are shown below Year 0 (S1.100) (S1.100) Year1 1.000
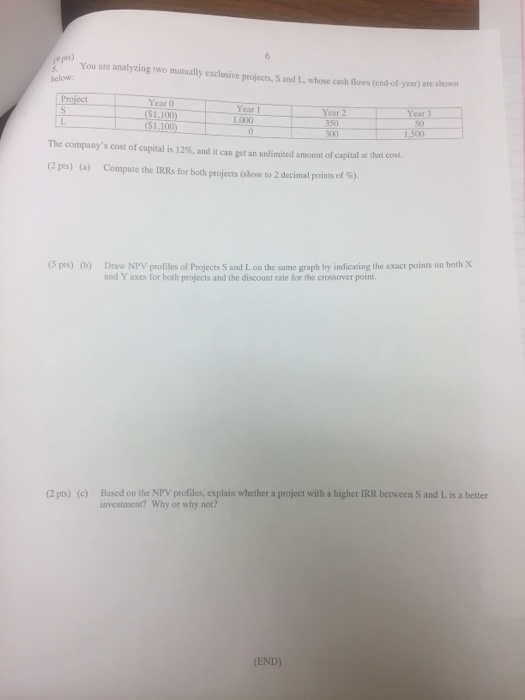
r9 pts) You are analyzing two mutually exclusive projects, S and I, whose cash flows (end-of-year) are shown below Year 0 (S1.100) (S1.100) Year1 1.000 Year 2 "Years 50 The company's cost of capital is 12%, and it can get an unlimited amount of capital at that cost. (2 pts) Compute the IRRs for both projects (show to 2 decimal points of %). (a) (S pts) Draw NPV profiles of Projects S and L on the same graph by indicating the exact points on both X and Y axes for both projects and the discount rate for the crossover point (b) (2 pts) (c) Based on the NPV profiles, explain whether a project with a higher IRR between S and L is a better investment? Why or why not? END)
Step by Step Solution
There are 3 Steps involved in it

Get step-by-step solutions from verified subject matter experts