

Question: RADAOACIIVE ISOTOPE GRAPH Yeur Graph and Class Average Graph Graph your personal data based on the information you recorded in the data table. Be sure
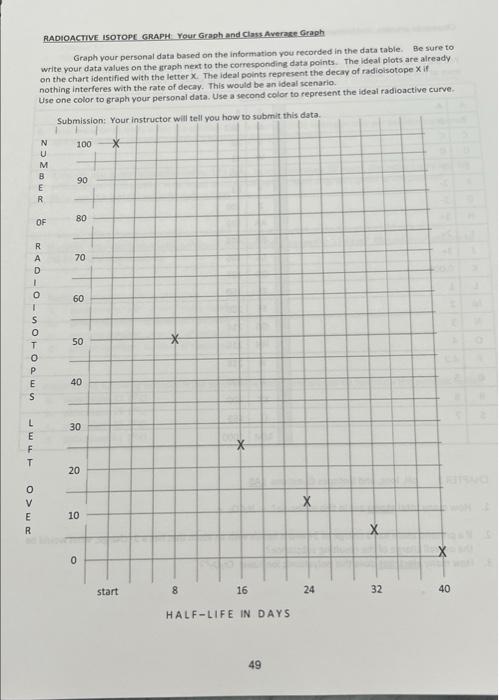
RADAOACIIVE ISOTOPE GRAPH Yeur Graph and Class Average Graph Graph your personal data based on the information you recorded in the data table. Be sure to. write your data values on the graph newt to the corresponding data points. The ideal plots are already on the chart identified with the letter x. The ideal points represent the decay of radioisotope x if nothine interferes with the rate of decay. This would be an ideal scenario
Step by Step Solution
There are 3 Steps involved in it
1 Expert Approved Answer
Step: 1 Unlock

Question Has Been Solved by an Expert!
Get step-by-step solutions from verified subject matter experts
Step: 2 Unlock
Step: 3 Unlock