

Question: rate for answer quickly! D Question 5 5 pts A stacked column chart shows the relationship of individual items to the whole by comparing the
 rate for answer quickly!
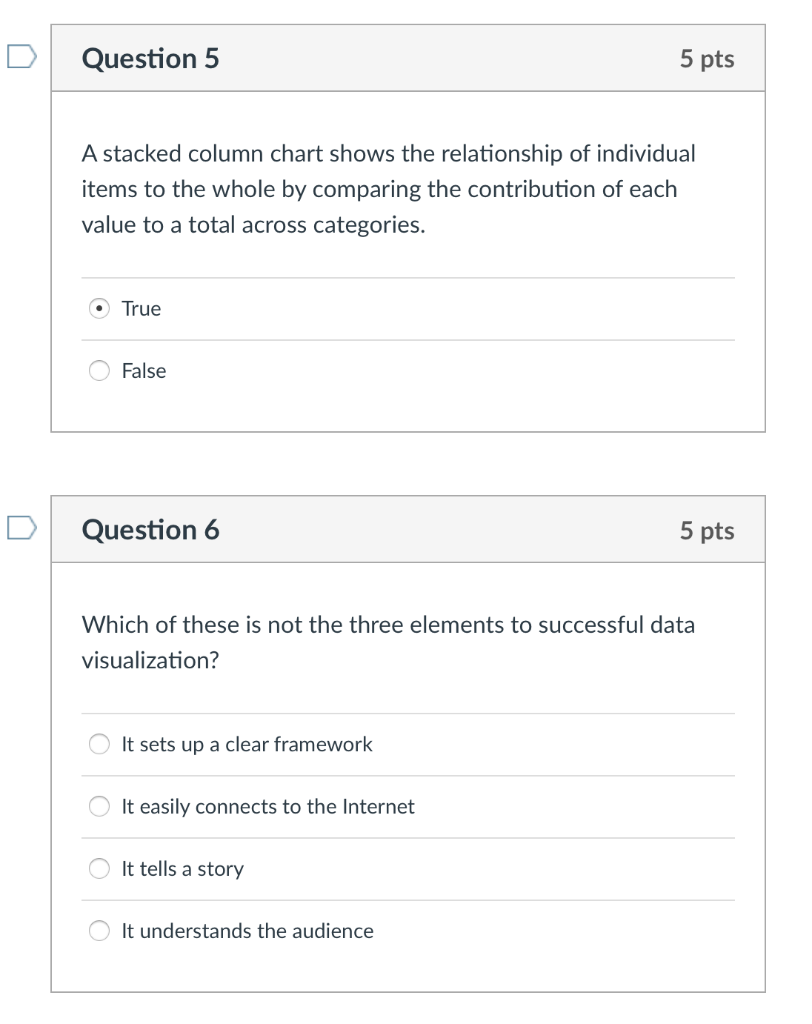
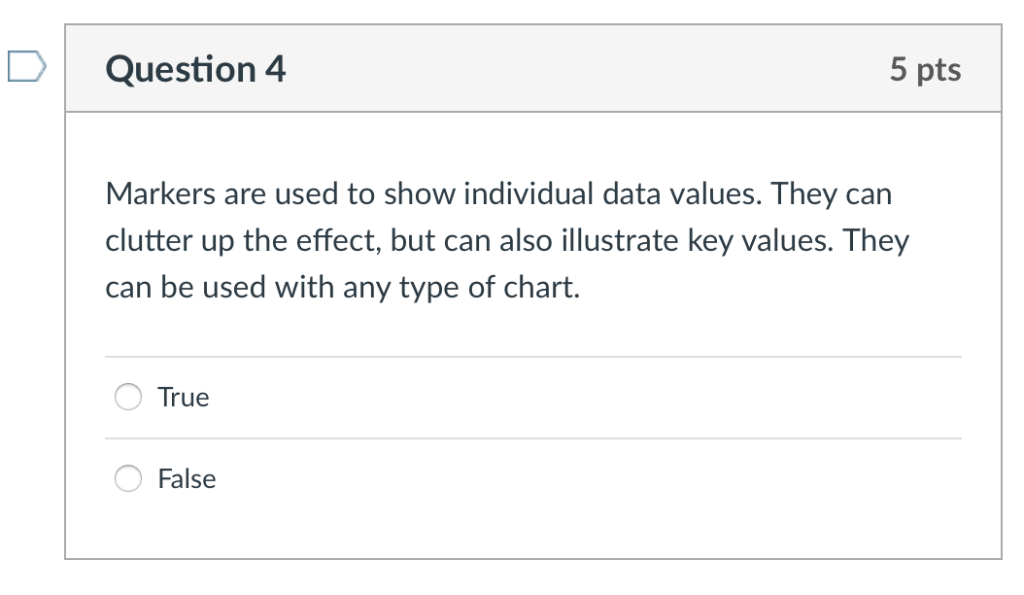
D Question 5 5 pts A stacked column chart shows the relationship of individual items to the whole by comparing the contribution of each value to a total across categories. True False DQuestion 6 5 pts Which of these is not the three elements to successful data visualization? It sets up a clear framework It easily connects to the Internet It tells a story O It understands the audience DI Question 4 5 pts Markers are used to show individual data values. They can clutter up the effect, but can also illustrate key values. They can be used with any type of chart. True False
Step by Step Solution
There are 3 Steps involved in it
1 Expert Approved Answer
Step: 1 Unlock

Question Has Been Solved by an Expert!
Get step-by-step solutions from verified subject matter experts
Step: 2 Unlock
Step: 3 Unlock