

Question: Read aloud MESAdd text V Draw Highlig CD Page view 2 2. Surface defects have been counted on 25 rectangular steel plates when the process
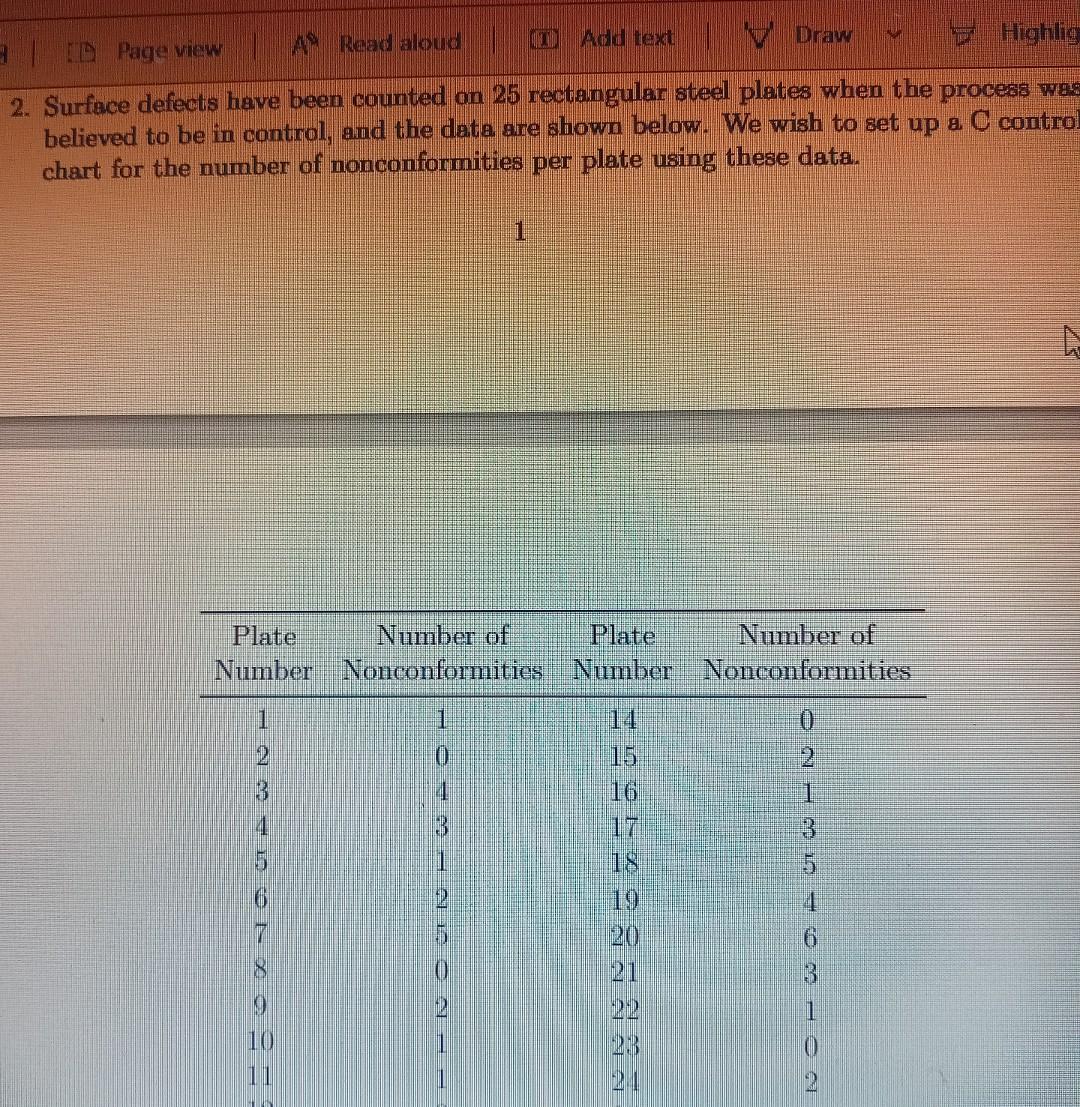
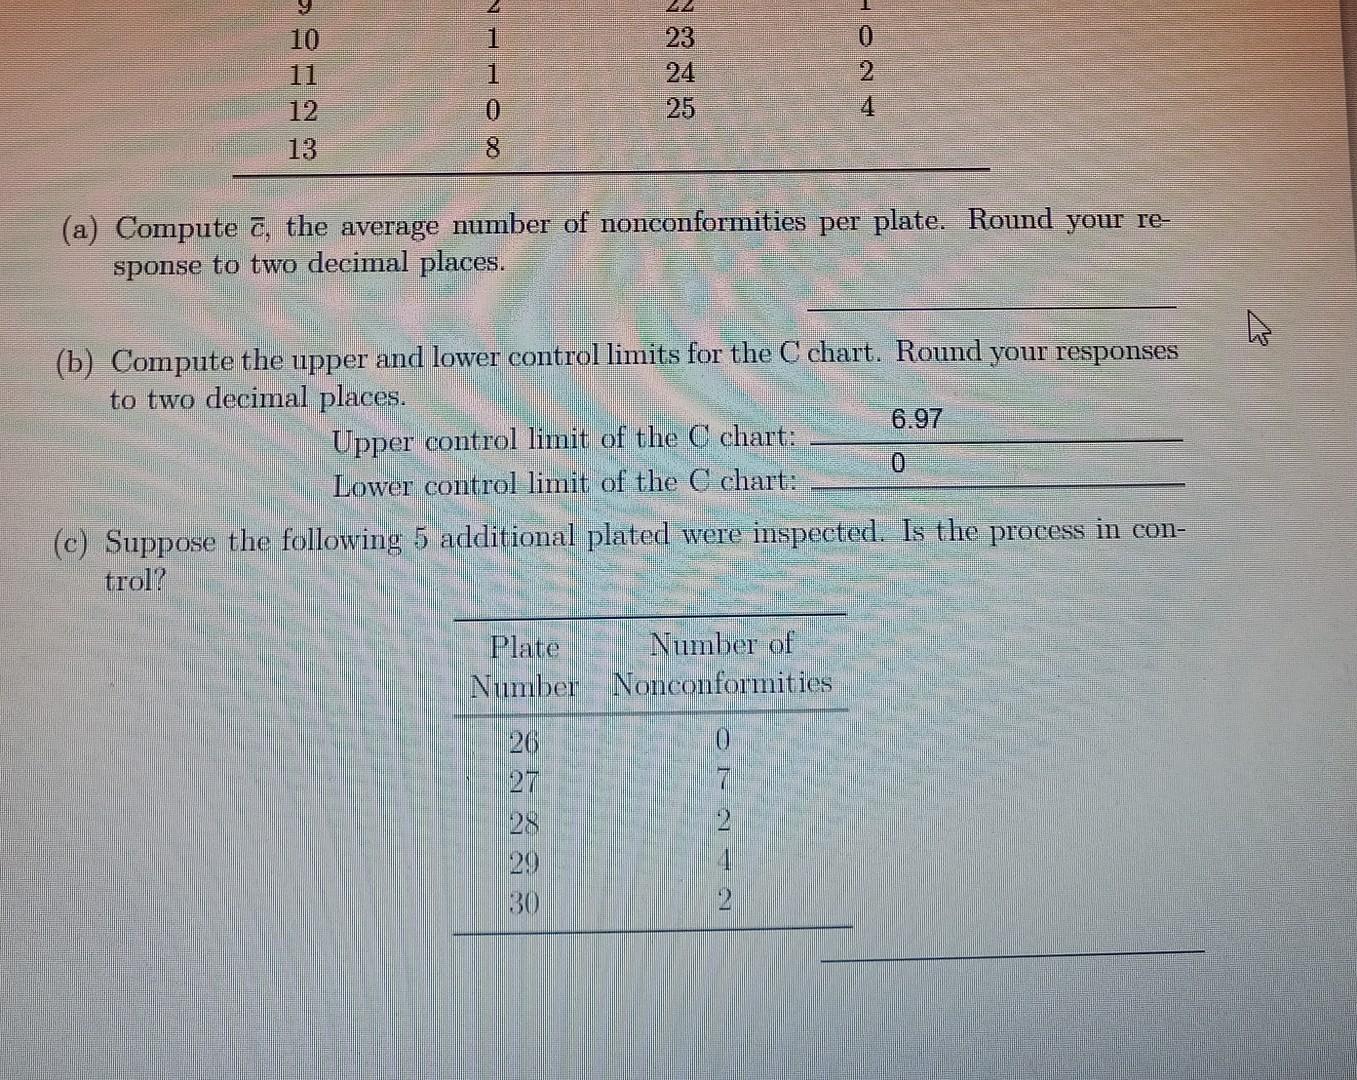
Read aloud MESAdd text V Draw Highlig CD Page view 2 2. Surface defects have been counted on 25 rectangular steel plates when the process was believed to be in control, and the data are shown below. We wish to set up a C control chart for the number of nonconformities per plate using these data. 1 Plate Number of Plate Number of Number Nonconformities Number Nonconformities 1 1 15 3 17 AM 10 ORE O=ANON 19 20 - - - - - - - 12 na 223 2 10 11 12 0 oo O EN 23 24 25 HON 0 8 13 (a) Compute 7, the average number of nonconformities per plate. Round your re- sponse to two decimal places. (b) Compute the upper and lower control limits for the C chart. Round your responses to two decimal places. 6.97 Upper control limit of the C chart: Lower control limit of the C chart: (c) Suppose the following 5 additional plated were inspected. Is the process in con- trol? Plate Number of Number Nonconformities 0 7 26 27 28 29 30 2 2
Step by Step Solution
There are 3 Steps involved in it
1 Expert Approved Answer
Step: 1 Unlock

Question Has Been Solved by an Expert!
Get step-by-step solutions from verified subject matter experts
Step: 2 Unlock
Step: 3 Unlock