

Question: Read the First Investments Case from the Harvard Case pack and as a team prepare a memo that addresses the following questions to complete the
Read the First Investments Case from the Harvard Case pack and as a team prepare a memo that addresses the following questions to complete the assignment given to Aldrich.
- What is the financial explanation of why the company's return on stockholders' equity varied during the period? For example, what is due to changes in profit levels? Improved inventory turnover? etc. Be specific.
- Distinguish between how the results in the areas under the control of operating and financing executives influence this return figure

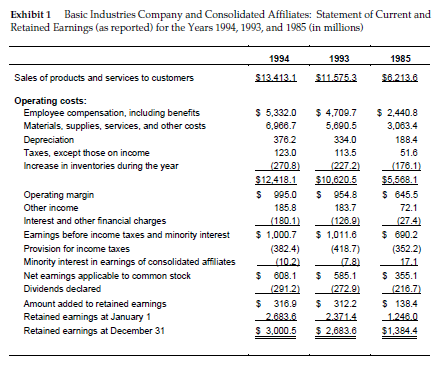
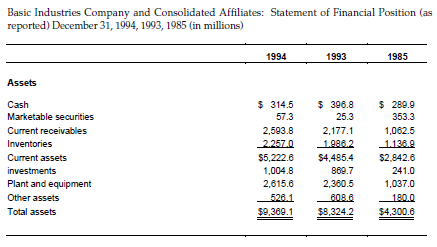
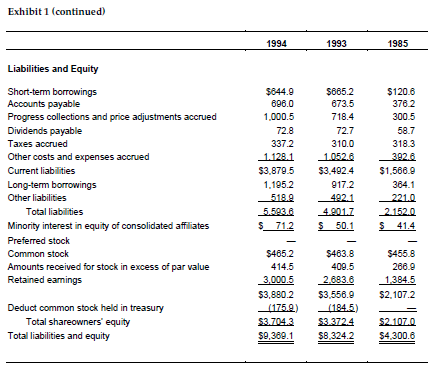
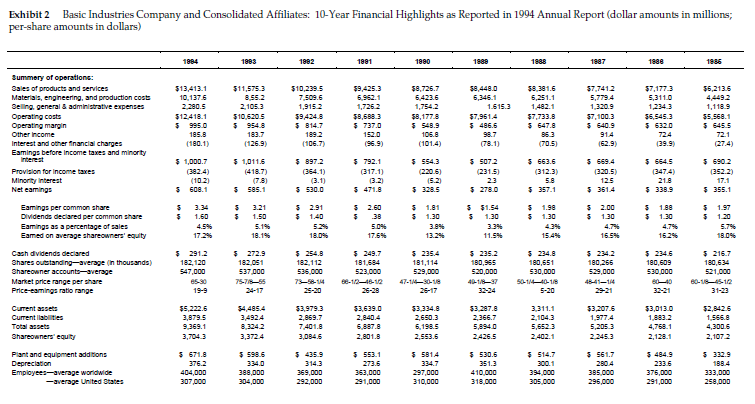
First Investments, Inc.: Analysis of Financial Statements In March 1995, Fred Aldrich, a summer trainee with the First Investments, Inc., was called into the office of the head of investment analysis section of the trust department. The following conversation took place: Fred, here are the 1994, 1993, and 1985 Basic Industries Company's financials (Exhibit 1) and a 10-year summary (Exhibit 2). Our trust department has owned this stock since the early 1980s. As you know, our portfolio people place a lot of emphasis on the quality of a company's earnings and the return on owners' equity in making stock selections. Well, they are worried. The 1994 Basic Industries annual report shows a decline in the return on owners' equity. Now, they want us to comment on the way that the company has achieved its return on equity over the last 10 years, starting with 1985. I would like you to prepare this analysis. I suggest you forget the strike years of 1989 and 1990. Also, concentrate on what happened in the 1993-1994 period. I hope the analysis will include a direct comparison of the quality of 1985 and 1994 returns on stockholders' equity and the other key financial ratios for these two years. Finally, you should know that the company has not changed its accounting policies and practices materially over the last decade. The only changes have been due to new standards issued by the FASB, but these have not materially distorted the comparative data. Basic Industries is a diversified multinational corporation with major shares in various electrical related markets. Exhibit 1 Basic Industries Company and Consolidated Affiliates: Statement of Current and Retained Earnings (as reported) for the Years 1994, 1993, and 1985 (in millions) Sales of products and services to customers Operating costs: Employee compensation, including benefits Materials, supplies, services, and other costs Depreciation Taxes, except those on income Increase in inventories during the year Operating margin Other income Interest and other financial charges Earnings before income taxes and minority interest Provision for income taxes Minority interest in earnings of consolidated affiliates Net earnings applicable to common stock Dividends declared Amount added to retained eamings Retained earnings at January 1 Retained earnings at December 31 1994 $13.413.1 $ 5,332.0 6,966.7 376.2 123.0 (270.8) $12.418.1 $ 995.0 185.8 (180.1) $ 1,000.7 (382.4) (10.2) $ 608.1 (291.2) $310.9 2.683.6 $ 3,000.5 1993 $11.575.3 $ 4,709.7 5,690.5 334.0 113.5 (227.2) $10,620.5 $ 954.8 183.7 (126.9) $ 1,011.6 (418.7) (7.8) $ 585.1 (272.9) $312.2 2.371.4 $ 2,683.6 1985 $6.213.6 $ 2,440.8 3,063.4 188.4 51.6 (176.1) $5,568.1 $ 645.5 72.1 (27.4) $690.2 (352.2) 17.1 $ 355.1 (216.7) $ 138.4 1.246.0 $1,384.4 Basic Industries Company and Consolidated Affiliates: Statement of Financial Position (as reported) December 31, 1994, 1993, 1985 (in millions) Assets Cash Marketable securities Current receivables Inventories Current assets investments Plant and equipment Other assets Total assets 1994 $ 314.5 57.3 2,593.8 2.257.0 $5,222.6 1,004.8 2,615.6 526.1 $9,369.1 1993 $ 396.8 25.3 2,177.1 1.986.2 $4,485.4 869.7 2,360.5 608.6 $8,324.2 1985 $ 289.9 353.3 1,062.5 1.136.9 $2,842.6 241.0 1,037.0 180.0 $4,300.6 Exhibit 1 (continued) Liabilities and Equity Short-term borrowings Accounts payable Progress collections and price adjustments accrued Dividends payable Taxes accrued Other costs and expenses accrued Current liabilities Long-term borrowings Other liabilities Total liabilities Minority interest in equity of consolidated affiliates Preferred stock Common stock Amounts received for stock in excess of par value Retained earnings Deduct common stock held in treasury Total shareowners' equity Total liabilities and equity 1994 $644.9 696.0 1,000.5 72.8 337.2 1.128.1 $3,879.5 1,195.2 518.9 5.503.0 $ 71.2 $465.2 414.5 3,000.5 1993 $3.704.3 $9,389.1 $665.2 673.5 718.4 72.7 310.0 1.052.6 $3,492.4 917.2 492.1 $463.8 409.5 2,683.6 $3,880.2 $3,556.9 (175.9) (184.5) 4.901.7 $ 50.1 $3.372.4 $8,324.2 1985 $120.6 376.2 300.5 58.7 318.3 392.6 $1,566.9 364.1 221.0 2.152.0 $ 41.4 $455.8 266.9 1,384.5 $2,107.2 $2.107.0 $4,300.6 Exhibit 2 Basic Industries Company and Consolidated Affiliates: 10-Year Financial Highlights as Reported in 1994 Annual Report (dollar amounts in millions; per-share amounts in dollars) Summery of operations: Sales of products and services Materials, engineering, and production costs Selling, general & administrative expenses Operating costs Operating margin Other Income Interest and other financial charges Eamings before income taxes and minority Interest Provision for income taxes Minority interest Net eamings Earnings per common share Dividends declared per common share Earnings as a percentage of sales Eamed on average shareowners' equity Cash dividends declared Shares outstanding-average (in thousands) Shareowner accounts-average Market price range per share Price-eamings ratio range Current assets Current liabilities Total assets Shareowners' equity Plant and equipment additions Depreciation Employees-average worldwide -average United States $13,413.1 10.137.6 2,280.5 $12,418.1 $ 995.0 185.8 (180.1) 1884 $ 1,000.7 (382.4) (10.2) 608.1 $ $ $ 3.34 1.60 4.5% 17.2% $ 291.2 182,120 547,000 65-30 19-9 $5,222.6 3,879.5 9,369.1 3,704.3 $ 671.8 376.2 404,000 307,000 $11,575.3 8.55.2 2,105.3 $10,620.5 1883 $ $ 1,011.6 $ 183.7 (126.9) (418.7) (7.8) 585.1 3.21 1.50 5.1% 18.1% $ 272.9 182,051 537,000 75-718-55 24-17 $4,485.4 3,4924 8,324.2 3,372.4 $ 598.6 334.0 388,000 304,000 1882 $10,239.5 7,509.6 1,915.2 $9,424.8 $814.7 189.2 (106.7) $897.2 (364.1) (3.1) $ 530.0 $ 2.91 $ 1.40 5.2% 18.0% $ 254.8 182,112 536,000 73-58-14 25-20 $3,979.3 2,869.7 7,401.8 3,084.6 $ 435.9 314.3 369,000 292,000 1881 $9,425.3 6,962.1 1,726.2 $8,688.3 $ 737.0 152.0 (96.9) $792.1 (317.1) $ 471.8 $ 2.60 $ 38 5.0% 17.6% $249.7 181,684 523,000 66-1/2-16-12 $3,639.0 2,840.4 6,887.8 2,801.8 $ 553.1 273.6 363,000 291,000 1990 $8,726.7 6,423.6 1,754.2 $8,177.8 $548.9 106.8 (101.4) $ 554.3 (220.6) $ 328.5 $ 1.81 $ 1.30 3.8% 13.2% $ 235.4 181,114 529,000 47-1/4-30-18 26-17 $3,334.8 2,650.3 6,198.5 2,553.6 $5814 334.7 297,000 310,000 1888 $8,448.0 6,346.1 1.615.3 $7,961.4 $486.6 98.7 (78.1) $ 507.2 (231.5) 23 $ 278.0 $ $1.54 $ 1.30 3.3% 11.5% $ 235.2 180,965 520,000 40-1/8-37 $3,287.8 2,366.7 5,894.0 2,426.5 $530.6 351.3 410,000 318,000 1888 $8,381.6 6,251.1 1,482.1 $7,733.8 $ 647.8 86.3 (70.5) $ 663.6 (312.3) 5.8 $ 357.1 $ 1.98 $ 1.30 15.4% $234.8 180,651 530,000 50-1/4-40-1/8 5-20 3,311.1 2,104.3 5,652.3 2,402.1 $514.7 300.1 394,000 305,000 1887 $7,741.2 5,779.4 1,320.9 $7,100.3 $ 640.9 91.4 (62.9) $ 669.4 (320.5) 12.5 $361.4 $ 2.00 $ 1.30 4.7% 16.5% $ 234.2 180,266 529,000 48-41-1/4 29-21 $3,207.6 1,977.4 5,205.3 2,245.3 $ 561.7 280.4 385,000 296,000 1888 $7,177.3 5,311.0 1,234.3 $6,545.3 $ 632.0 724 (39.9) $ 664.5 (347.4) 21.8 $ 338.9 $ 1.88 $ 1.30 16.2% $ 234.6 180,609 530,000 60-40 32-21 $3,013.0 1,883.2 4,768.1 2,128.1 $ 484.9 233.6 376,000 291,000 1886 $6,213.6 4,449.2 1,118.9 $5,568.1 $ 645.5 72.1 (27.4) $ 690.2 (352.2) 17.1 $ 355.1 $ 1.97 $ 1.20 5.7% 18.0% $ 216.7 180,634 521,000 60-18-45-12 31-23 $2,842.6 1,566.8 4,300.6 2,107.2 $ 332.9 188.4 333,000 258,000 First Investments, Inc.: Analysis of Financial Statements In March 1995, Fred Aldrich, a summer trainee with the First Investments, Inc., was called into the office of the head of investment analysis section of the trust department. The following conversation took place: Fred, here are the 1994, 1993, and 1985 Basic Industries Company's financials (Exhibit 1) and a 10-year summary (Exhibit 2). Our trust department has owned this stock since the early 1980s. As you know, our portfolio people place a lot of emphasis on the quality of a company's earnings and the return on owners' equity in making stock selections. Well, they are worried. The 1994 Basic Industries annual report shows a decline in the return on owners' equity. Now, they want us to comment on the way that the company has achieved its return on equity over the last 10 years, starting with 1985. I would like you to prepare this analysis. I suggest you forget the strike years of 1989 and 1990. Also, concentrate on what happened in the 1993-1994 period. I hope the analysis will include a direct comparison of the quality of 1985 and 1994 returns on stockholders' equity and the other key financial ratios for these two years. Finally, you should know that the company has not changed its accounting policies and practices materially over the last decade. The only changes have been due to new standards issued by the FASB, but these have not materially distorted the comparative data. Basic Industries is a diversified multinational corporation with major shares in various electrical related markets. Exhibit 1 Basic Industries Company and Consolidated Affiliates: Statement of Current and Retained Earnings (as reported) for the Years 1994, 1993, and 1985 (in millions) Sales of products and services to customers Operating costs: Employee compensation, including benefits Materials, supplies, services, and other costs Depreciation Taxes, except those on income Increase in inventories during the year Operating margin Other income Interest and other financial charges Earnings before income taxes and minority interest Provision for income taxes Minority interest in earnings of consolidated affiliates Net earnings applicable to common stock Dividends declared Amount added to retained eamings Retained earnings at January 1 Retained earnings at December 31 1994 $13.413.1 $ 5,332.0 6,966.7 376.2 123.0 (270.8) $12.418.1 $ 995.0 185.8 (180.1) $ 1,000.7 (382.4) (10.2) $ 608.1 (291.2) $310.9 2.683.6 $ 3,000.5 1993 $11.575.3 $ 4,709.7 5,690.5 334.0 113.5 (227.2) $10,620.5 $ 954.8 183.7 (126.9) $ 1,011.6 (418.7) (7.8) $ 585.1 (272.9) $312.2 2.371.4 $ 2,683.6 1985 $6.213.6 $ 2,440.8 3,063.4 188.4 51.6 (176.1) $5,568.1 $ 645.5 72.1 (27.4) $690.2 (352.2) 17.1 $ 355.1 (216.7) $ 138.4 1.246.0 $1,384.4 Basic Industries Company and Consolidated Affiliates: Statement of Financial Position (as reported) December 31, 1994, 1993, 1985 (in millions) Assets Cash Marketable securities Current receivables Inventories Current assets investments Plant and equipment Other assets Total assets 1994 $ 314.5 57.3 2,593.8 2.257.0 $5,222.6 1,004.8 2,615.6 526.1 $9,369.1 1993 $ 396.8 25.3 2,177.1 1.986.2 $4,485.4 869.7 2,360.5 608.6 $8,324.2 1985 $ 289.9 353.3 1,062.5 1.136.9 $2,842.6 241.0 1,037.0 180.0 $4,300.6 Exhibit 1 (continued) Liabilities and Equity Short-term borrowings Accounts payable Progress collections and price adjustments accrued Dividends payable Taxes accrued Other costs and expenses accrued Current liabilities Long-term borrowings Other liabilities Total liabilities Minority interest in equity of consolidated affiliates Preferred stock Common stock Amounts received for stock in excess of par value Retained earnings Deduct common stock held in treasury Total shareowners' equity Total liabilities and equity 1994 $644.9 696.0 1,000.5 72.8 337.2 1.128.1 $3,879.5 1,195.2 518.9 5.503.0 $ 71.2 $465.2 414.5 3,000.5 1993 $3.704.3 $9,389.1 $665.2 673.5 718.4 72.7 310.0 1.052.6 $3,492.4 917.2 492.1 $463.8 409.5 2,683.6 $3,880.2 $3,556.9 (175.9) (184.5) 4.901.7 $ 50.1 $3.372.4 $8,324.2 1985 $120.6 376.2 300.5 58.7 318.3 392.6 $1,566.9 364.1 221.0 2.152.0 $ 41.4 $455.8 266.9 1,384.5 $2,107.2 $2.107.0 $4,300.6 Exhibit 2 Basic Industries Company and Consolidated Affiliates: 10-Year Financial Highlights as Reported in 1994 Annual Report (dollar amounts in millions; per-share amounts in dollars) Summery of operations: Sales of products and services Materials, engineering, and production costs Selling, general & administrative expenses Operating costs Operating margin Other Income Interest and other financial charges Eamings before income taxes and minority Interest Provision for income taxes Minority interest Net eamings Earnings per common share Dividends declared per common share Earnings as a percentage of sales Eamed on average shareowners' equity Cash dividends declared Shares outstanding-average (in thousands) Shareowner accounts-average Market price range per share Price-eamings ratio range Current assets Current liabilities Total assets Shareowners' equity Plant and equipment additions Depreciation Employees-average worldwide -average United States $13,413.1 10.137.6 2,280.5 $12,418.1 $ 995.0 185.8 (180.1) 1884 $ 1,000.7 (382.4) (10.2) 608.1 $ $ $ 3.34 1.60 4.5% 17.2% $ 291.2 182,120 547,000 65-30 19-9 $5,222.6 3,879.5 9,369.1 3,704.3 $ 671.8 376.2 404,000 307,000 $11,575.3 8.55.2 2,105.3 $10,620.5 1883 $ $ 1,011.6 $ 183.7 (126.9) (418.7) (7.8) 585.1 3.21 1.50 5.1% 18.1% $ 272.9 182,051 537,000 75-718-55 24-17 $4,485.4 3,4924 8,324.2 3,372.4 $ 598.6 334.0 388,000 304,000 1882 $10,239.5 7,509.6 1,915.2 $9,424.8 $814.7 189.2 (106.7) $897.2 (364.1) (3.1) $ 530.0 $ 2.91 $ 1.40 5.2% 18.0% $ 254.8 182,112 536,000 73-58-14 25-20 $3,979.3 2,869.7 7,401.8 3,084.6 $ 435.9 314.3 369,000 292,000 1881 $9,425.3 6,962.1 1,726.2 $8,688.3 $ 737.0 152.0 (96.9) $792.1 (317.1) $ 471.8 $ 2.60 $ 38 5.0% 17.6% $249.7 181,684 523,000 66-1/2-16-12 $3,639.0 2,840.4 6,887.8 2,801.8 $ 553.1 273.6 363,000 291,000 1990 $8,726.7 6,423.6 1,754.2 $8,177.8 $548.9 106.8 (101.4) $ 554.3 (220.6) $ 328.5 $ 1.81 $ 1.30 3.8% 13.2% $ 235.4 181,114 529,000 47-1/4-30-18 26-17 $3,334.8 2,650.3 6,198.5 2,553.6 $5814 334.7 297,000 310,000 1888 $8,448.0 6,346.1 1.615.3 $7,961.4 $486.6 98.7 (78.1) $ 507.2 (231.5) 23 $ 278.0 $ $1.54 $ 1.30 3.3% 11.5% $ 235.2 180,965 520,000 40-1/8-37 $3,287.8 2,366.7 5,894.0 2,426.5 $530.6 351.3 410,000 318,000 1888 $8,381.6 6,251.1 1,482.1 $7,733.8 $ 647.8 86.3 (70.5) $ 663.6 (312.3) 5.8 $ 357.1 $ 1.98 $ 1.30 15.4% $234.8 180,651 530,000 50-1/4-40-1/8 5-20 3,311.1 2,104.3 5,652.3 2,402.1 $514.7 300.1 394,000 305,000 1887 $7,741.2 5,779.4 1,320.9 $7,100.3 $ 640.9 91.4 (62.9) $ 669.4 (320.5) 12.5 $361.4 $ 2.00 $ 1.30 4.7% 16.5% $ 234.2 180,266 529,000 48-41-1/4 29-21 $3,207.6 1,977.4 5,205.3 2,245.3 $ 561.7 280.4 385,000 296,000 1888 $7,177.3 5,311.0 1,234.3 $6,545.3 $ 632.0 724 (39.9) $ 664.5 (347.4) 21.8 $ 338.9 $ 1.88 $ 1.30 16.2% $ 234.6 180,609 530,000 60-40 32-21 $3,013.0 1,883.2 4,768.1 2,128.1 $ 484.9 233.6 376,000 291,000 1886 $6,213.6 4,449.2 1,118.9 $5,568.1 $ 645.5 72.1 (27.4) $ 690.2 (352.2) 17.1 $ 355.1 $ 1.97 $ 1.20 5.7% 18.0% $ 216.7 180,634 521,000 60-18-45-12 31-23 $2,842.6 1,566.8 4,300.6 2,107.2 $ 332.9 188.4 333,000 258,000
Step by Step Solution
There are 3 Steps involved in it

Get step-by-step solutions from verified subject matter experts