

Question: Read the PowerPoint document that is attached. 1. In a bulleted list, identify the out of control conditions that you see on each slide and
Read the PowerPoint document that is attached.
1. In a bulleted list, identify the out of control conditions that you see on each slide and indicate which control chart rule(s) from the YouTube video (Control Chart: History, Concept, & Nelson rules) justifies your answer Note, if more than one rule applies, then note all of the rules. o NOTE: For Nelson's rules, just focus on the following 4 rules
- 1 point above the UCL or below the LCL
- 7 consecutive trending points
- 7 consecutive points on the same side of the center line
- 14 oscillating points.
- For both charts, which data points are common cause variation? Which are special cause variation?
- For Slide 2 - Control Chart - Percentage of Schedule Attainment, what do you think happened between 9/19 and beyond? Specifically, do you feel that something changed in that process? Explain
- For Slide 3 - Control Chart - March Painted Products, did the difference between the UCL and LCL from 8/13 and beyond get bigger or smaller? Is that change desirable or not? Explain
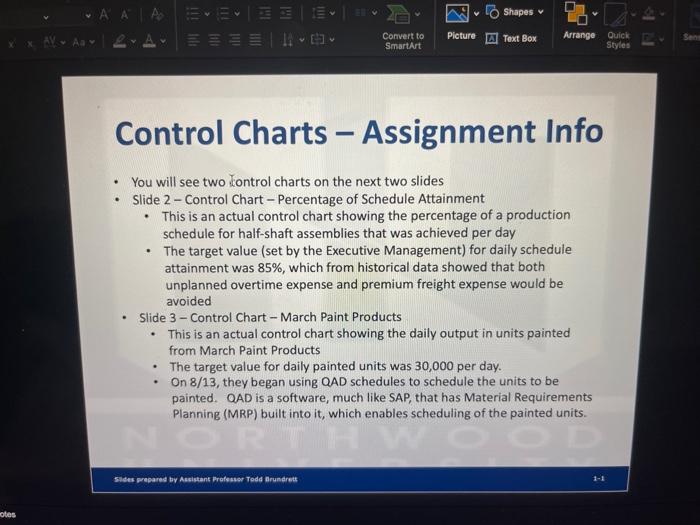
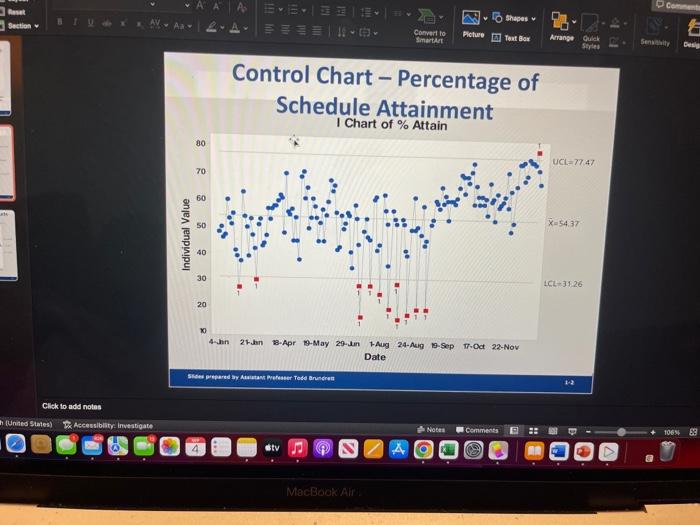
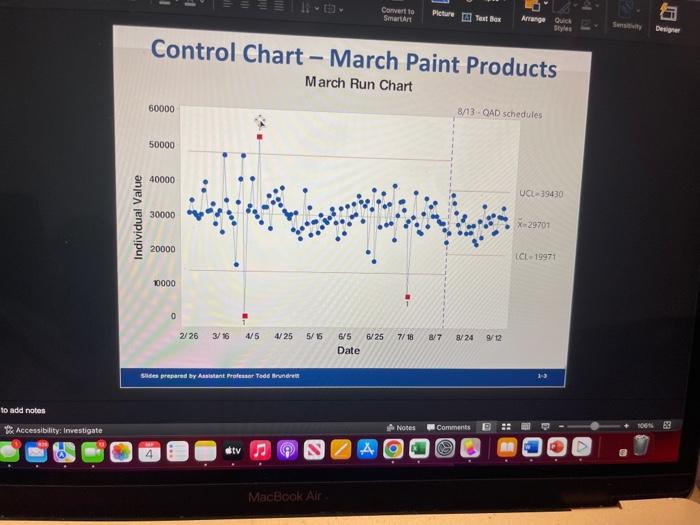
Control Chart - Percentage of Schedule Attainment I Chart of \% Attain Control Chart - March Paint Products March Run Chart - You will see two Kontrol charts on the next two slides - Slide 2-Control Chart-Percentage of Schedule Attainment - This is an actual control chart showing the percentage of a production schedule for half-shaft assemblies that was achieved per day - The target value (set by the Executive Management) for daily schedule attainment was 85%, which from historical data showed that both unplanned overtime expense and premium freight expense would be avoided - Slide 3-Control Chart - March Paint Products - This is an actual control chart showing the daily output in units painted from March Paint Products - The target value for daily painted units was 30,000 per day. - On 8/13, they began using QAD schedules to schedule the units to be painted. QAD is a software, much like SAP, that has Material Requirements Planning (MRP) built into it, which enables scheduling of the painted units
Step by Step Solution
There are 3 Steps involved in it

Get step-by-step solutions from verified subject matter experts