

Question: Real-Time Data Analysis Exercise* Price level (GDP deflator; 2012 = 100) + 133.2 *Real-time data provided by Federal Reserve Economic Data (FRED), Federal 132.2- Reserve
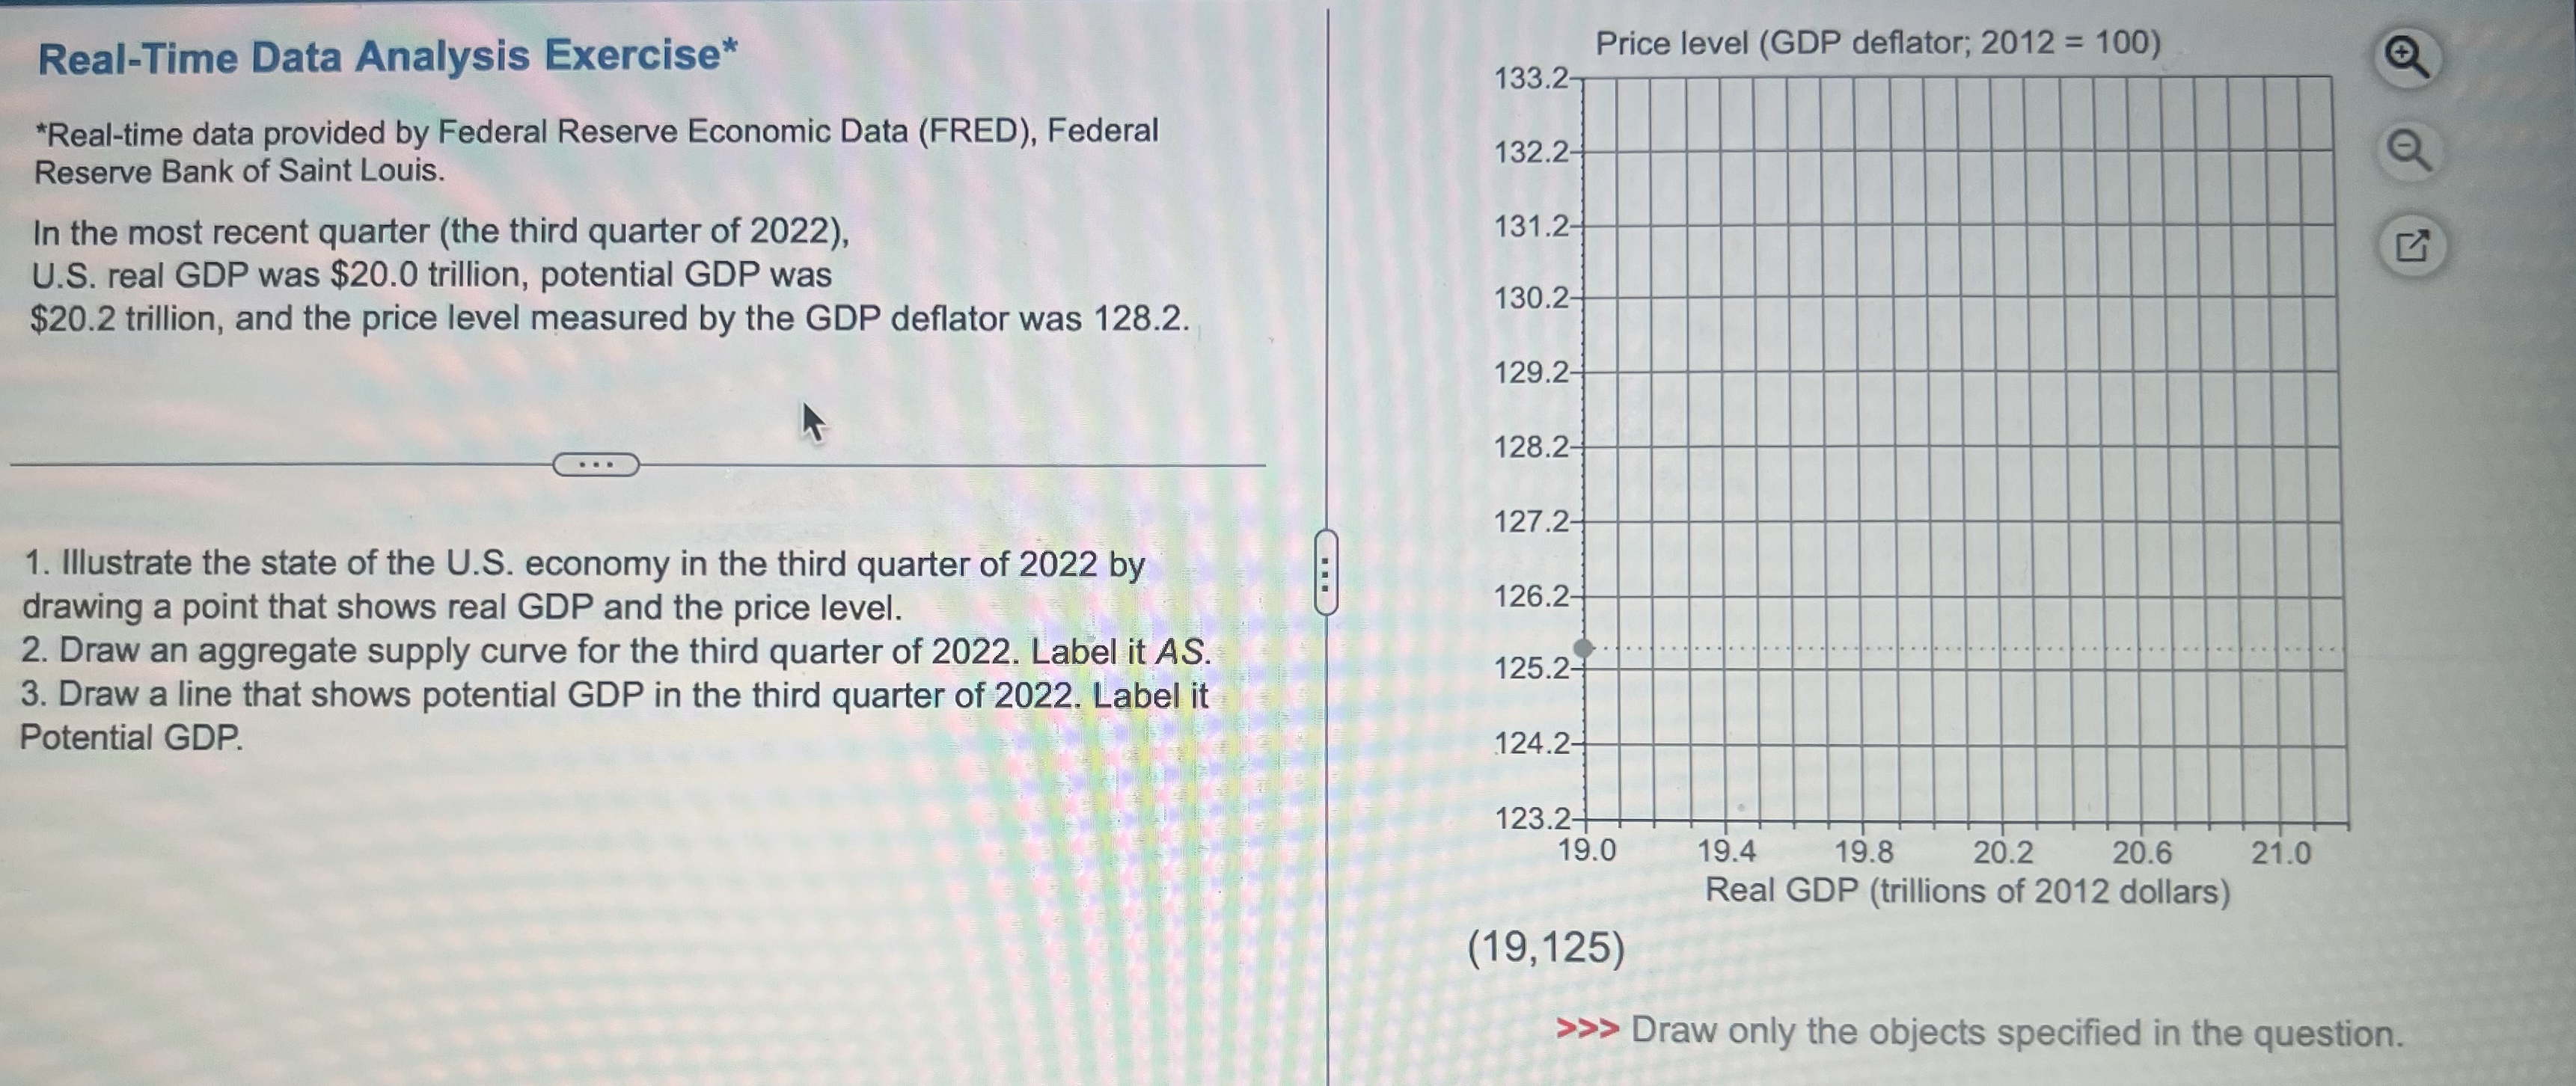
Real-Time Data Analysis Exercise* Price level (GDP deflator; 2012 = 100) + 133.2 *Real-time data provided by Federal Reserve Economic Data (FRED), Federal 132.2- Reserve Bank of Saint Louis. In the most recent quarter (the third quarter of 2022), 131.2- U.S. real GDP was $20.0 trillion, potential GDP was 130.2- $20.2 trillion, and the price level measured by the GDP deflator was 128.2. 129.2- 128.2- . . . 127.2- 1. Illustrate the state of the U.S. economy in the third quarter of 2022 by drawing a point that shows real GDP and the price level. 126.2- 2. Draw an aggregate supply curve for the third quarter of 2022. Label it AS. 125.2- 3. Draw a line that shows potential GDP in the third quarter of 2022. Label it Potential GDP. 124.2- 123.2- 19.0 19.4 19.8 20.2 20.6 21.0 Real GDP (trillions of 2012 dollars) (19,125) >>> Draw only the objects specified in the
Step by Step Solution
There are 3 Steps involved in it

Get step-by-step solutions from verified subject matter experts