

Question: Recalculate the expected portfolio return and standard deviation for difference of x1 and x2, assuming the correlaton coefficient p12=0. Plot the range of possible combinatins
Recalculate the expected portfolio return and standard deviation for difference of x1 and x2, assuming the correlaton coefficient p12=0. Plot the range of possible combinatins of expected return and standard deviation as in Figure 8-3. Repeat the problem for p12=+.25. Can you please explain your answers.
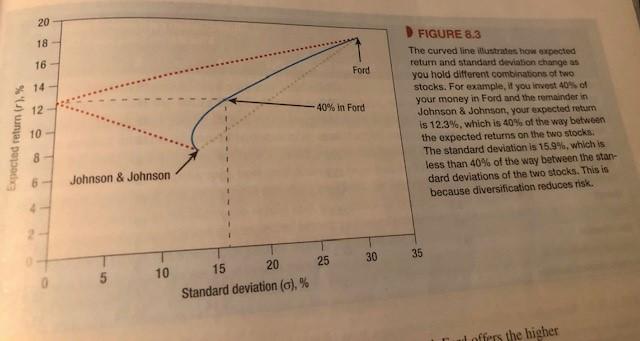
20 18 16 Ford 14 12 40% in Ford Expected return ir). % FIGURE 8.3 The curved line illustradeshow expected return and standard deviation change as you hold different combinations of two stocks. For example, you invest 40 your money in Ford and the remainder in Johnson & Johnson, your expected return is 12.3%, which is 40% of the way between the expected returns on the two stocks The standard deviation is 15.9%, which is less than 40% of the way between the stan- dard deviations of the two stocks. This is because diversification reduces risk. 10 8 Johnson & Johnson 30 35 25 10 15 20 Standard deviation (c),% al offers the higher 20 18 16 Ford 14 12 40% in Ford Expected return ir). % FIGURE 8.3 The curved line illustradeshow expected return and standard deviation change as you hold different combinations of two stocks. For example, you invest 40 your money in Ford and the remainder in Johnson & Johnson, your expected return is 12.3%, which is 40% of the way between the expected returns on the two stocks The standard deviation is 15.9%, which is less than 40% of the way between the stan- dard deviations of the two stocks. This is because diversification reduces risk. 10 8 Johnson & Johnson 30 35 25 10 15 20 Standard deviation (c),% al offers the higher
Step by Step Solution
There are 3 Steps involved in it

Get step-by-step solutions from verified subject matter experts