

Question: Recently, 30 users of statistical data software were asked how many text messages they sent in one day. Make a histogram to display the distribution
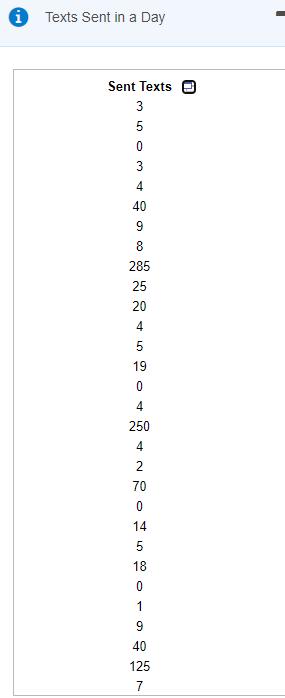
Recently, 30 users of statistical data software were asked how many text messages they sent in one day. Make a histogram to display the distribution of the numbers of text messages sent, and describe the distribution. The sample data are shown in the accompanying table.
1. Create a histogram of the numbers of text messages sent. Choose the correct answer below.
2. Describe the distribution. Choose the correct answer below.
The distribution appears to be left-skewed because of the high-end outlier.
The distribution appears to be symmetric because the left side is roughly a mirror image of the right side.
The distribution appears to be strongly right-skewed, with outliers.
The distribution appears to be right-skewed because of the low-end outlier.
The distribution appears to be strongly left-skewed, with outliers.
Texts Sent in a Day Sent Texts O 3 5 3 4 40 9 8 285 25 20 4 5 19 4 250 4 2 70 14 5 18 1 9. 40 125
Step by Step Solution
3.38 Rating (160 Votes )
There are 3 Steps involved in it
From the given data a frequency table ... View full answer

Get step-by-step solutions from verified subject matter experts