

Question: Refer the table below on the average excess return of the U.S. equity market and the standard deviation of that excess return Suppose that the
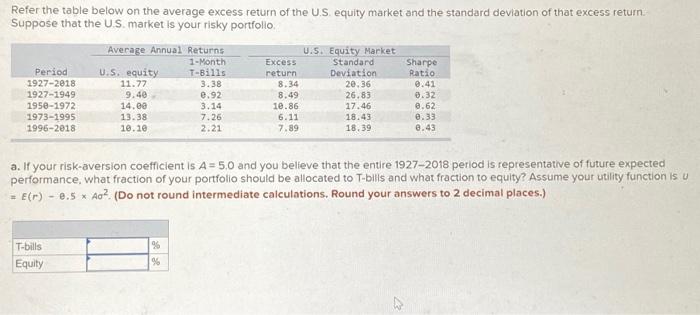
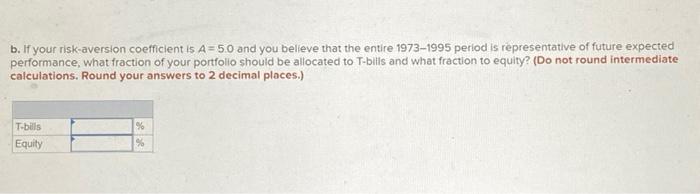
Refer the table below on the average excess return of the U.S. equity market and the standard deviation of that excess return Suppose that the US market is your risky portfolio Average Annual Returns U.S. Equity Market 1-Month Excess Standard Sharpe Period U.S. equity T-Bills return Deviation Ratio 1927-2018 11.77 3.38 8.34 20.36 0.41 1927-1949 9.40 2.92 8.49 26.83 0.32 1950-1972 14.00 3.14 10.86 17.46 0.62 1973-1995 13.38 7.26 6.11 18.43 0.33 1996-2018 10.10 2.21 7.89 18.39 2.43 a. If your risk-aversion coefficient is A = 5.0 and you believe that the entire 1927-2018 period is representative of future expected performance, what fraction of your portfolio should be allocated to T-bills and what fraction to equity Assume your utility function is u E() - 0.5 * Ao? (Do not round intermediate calculations, Round your answers to 2 decimal places.) T-bills Equity % % b. If your risk-aversion coefficient is A=5.0 and you believe that the entire 1973-1995 period is representative of future expected performance, what fraction of your portfolio should be allocated to T-bills and what fraction to equity? (Do not round intermediate calculations. Round your answers to 2 decimal places.) T-bils Equity % %
Step by Step Solution
There are 3 Steps involved in it

Get step-by-step solutions from verified subject matter experts