

Question: Refer to Chart 3 for this question. (Transfer the chart onto a PowerPoint slide, indicate answers on it and attach it in the answer template)
Refer to Chart 3 for this question. (Transfer the chart onto a PowerPoint slide, indicate answers on it and attach it in the answer template)
(a)With the help of suitable lines and annotations, indicate the trends for the following periods:
i.From the beginning of the chart to Feb 2017. ii.From Feb 2017 to Feb 2018.
(b) Reference to the period between Aug 2015 to Nov 2015, using suitable lines and annotations, indicate the pattern found. List TWO (2) characteristics of this pattern.
(c) Reference to the period between Jan 2016 to Mar 2017, using suitable lines, arrows and annotations, indicate the pattern found. Indicate the price objective ($) of this pattern when it is fully formed?
(d) Refer to the line marked (d). Name this line and explain how this line is formed.
(e) Reference to the period between Aug 2017 to Feb 2018, using suitable lines, arrows and annotations, indicate the pattern found. Indicate the price objective ($) of this pattern when it is fully formed.
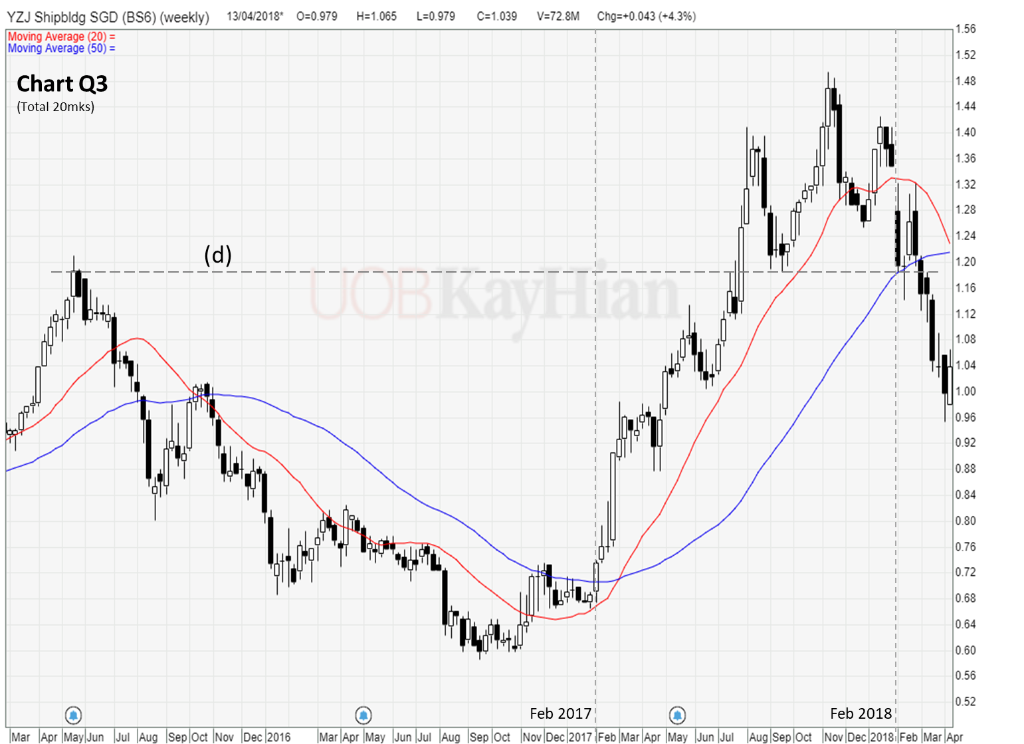
H=1.065 L=0.979 C=1.039 V=72.8M Chg=+0.043 (+4.3%) YZJ Shipbldg SGD (BS6) (weekly) 13/04/2018' O=0.979 Moving Average (20) = Moving Average (50) = 1.56 1.52 1.48 Chart Q3 (Total 20mks) 1.44 1.40 22 1.36 1.32 1.28 1.24 (d) 1.20 1.16 ) 1.12 1.08 11.04 1.00 0.96 0.92 0.88 0.84 0.80 0.76 0.72 0.68 10.64 10.60 0.56 0.52 Feb 2017 Feb 2018 Mar Apr May Jun Jul Aug Sep Oct Nov Dec 2017 Feb Mar Apr May Jun Jul Aug Sep Oct Nov Dec 2018 Feb Mar Apr Mar Apr May Jun Jul Aug Sep Oct Nov Dec 2016
Step by Step Solution
There are 3 Steps involved in it

Get step-by-step solutions from verified subject matter experts