

Question: Refer to Chart 3 for this question. (Transfer the chart onto a PowerPoint slide, indicate answers on it and attach it to the answer template)
Refer to Chart 3 for this question. (Transfer the chart onto a PowerPoint slide, indicate answers on it and attach it to the answer template)
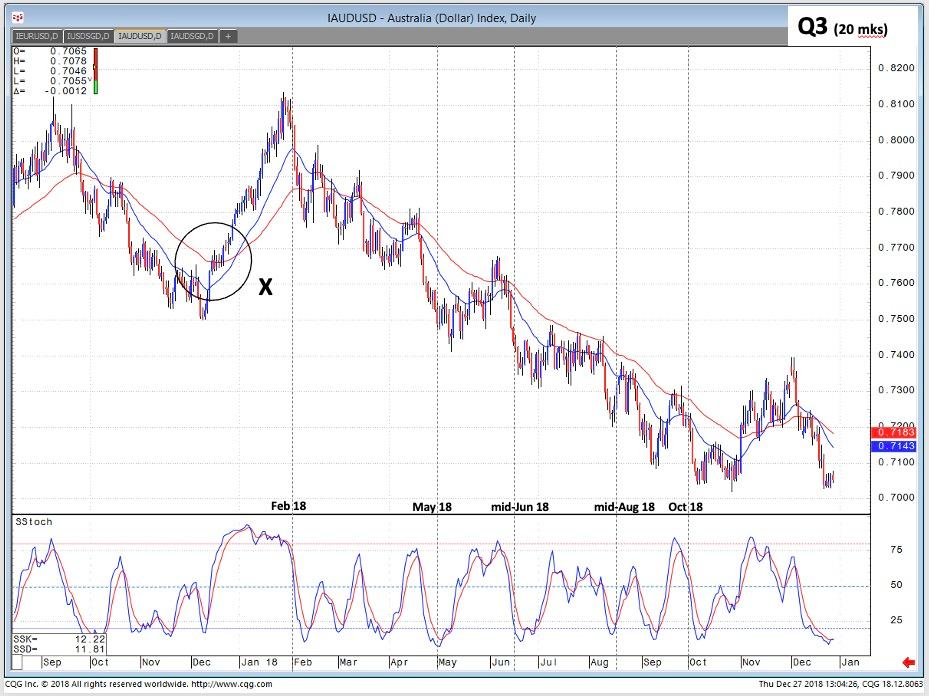
1.From Feb to Oct 2018, using suitable annotations, indicate the trend and lines during this period. (2 marks)
2.From May 2018 to mid-Jun 2018 of the chart, indicate with suitable annotations and lines the chart pattern that was formed. Name the pattern and include TWO (2) characteristics of this pattern. (4 marks)
3.Refer to the period between mid-Jun 2018 and mid-Aug 2018, indicate with suitable annotations and lines, the chart pattern that was formed. Name the pattern and include TWO (2) characteristics of this pattern. (4 marks)
4.A new trend was formed from Oct 2018 to the end of the chart. Using suitable annotations and lines, indicate the trend during this period. Reference to the end of the chart, indicate the prices of ONE (1) immediate support (S1) and the THREE (3) resistance levels (R1, R2 & R3). (4 marks)
5.Reference to the circle marked X on the chart. Indicate the THREE (3) signals given by the interaction between price and the two moving average lines. For a client who is risk-averse, which entry signal would you recommend and give ONE (1) advantage and ONE (1) disadvantage for using your recommended signal. (6 marks)
Step by Step Solution
There are 3 Steps involved in it

Get step-by-step solutions from verified subject matter experts