

Refer to Figure 11-2 below to answer the following questions. a. Identify the curves in the diagram.
Question:
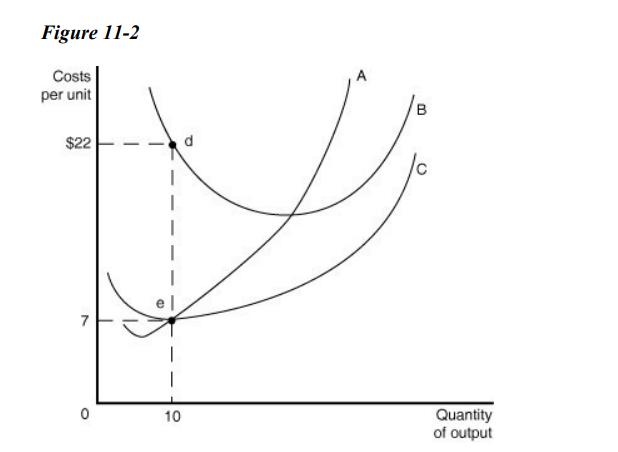
Refer to Figure 11-2 below to answer the following questions.
a. Identify the curves in the diagram.
A ________________________________________
B ________________________________________
C ________________________________________
b. What is the numerical value of fixed cost when the quantity of output = 10?
c. What is the numerical value of variable cost when the quantity of output = 10?
d. What is the numerical value of total cost when the quantity of output = 10?
e. What is the numerical value of average fixed cost when the quantity of output = 10?
f. What is the numerical value of average total cost when the quantity of output = 10?
g. On the graph identify the area that represents the total variable cost of production when the quantity of output = 10.
h. On the graph identify the area that represents the fixed cost of production when the quantity of output = 10.
Expert Answer:


Basic Technical Mathematics
ISBN: 9780137529896
12th Edition
Authors: Allyn J. Washington, Richard Evans
