

Question: Refer to Table S 6 . 1 - Factors for Computing Control Chart Limits ( 3 sigma ) for this problem. Twelve samples, each containing
Refer to Table S Factors for Computing Control Chart Limits sigma for this problem.
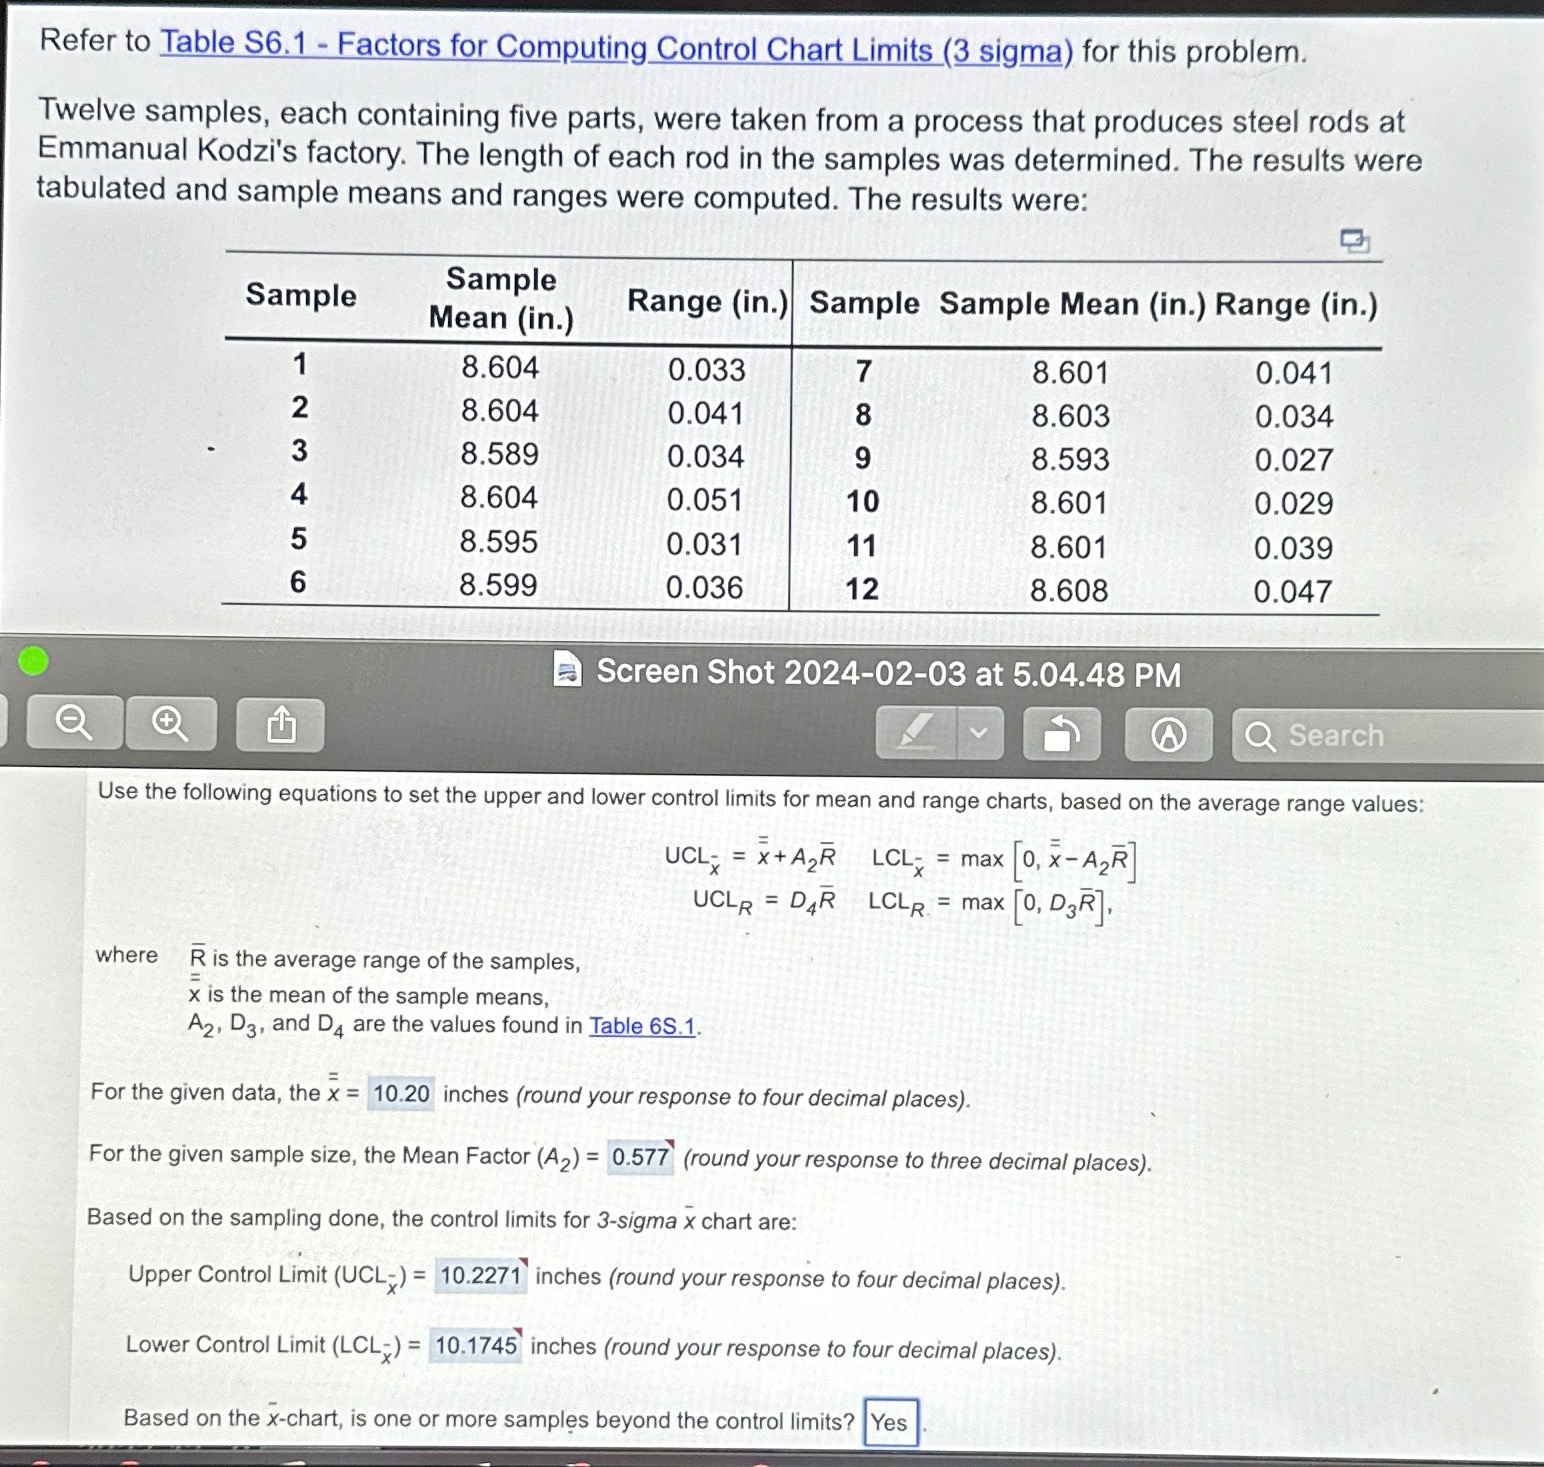
Twelve samples, each containing five parts, were taken from a process that produces steel rods at Emmanual Kodzi's factory. The length of each rod in the samples was determined. The results were tabulated and sample means and ranges were computed. The results were:
tableSampletableSampleMean inRange inSample Sample Mean in Range in
A Screen Shot at PM
Q
A
Search
Use the following equations to set the upper and lower control limits for mean and range charts, based on the average range values:
max
max
where is the average range of the samples,
is the mean of the sample means,
and are the values found in Table S
For the given data, the inches round your response to four decimal places
For the given sample size, the Mean Factor round your response to three decimal places
Based on the sampling done, the control limits for sigma chart are:
Upper Control Limit inches round your response to four decimal places
Lower Control Limit inches round your response to four decimal places
Based on the chart, is one or more samples beyond the control limits Yes
Step by Step Solution
There are 3 Steps involved in it
1 Expert Approved Answer
Step: 1 Unlock

Question Has Been Solved by an Expert!
Get step-by-step solutions from verified subject matter experts
Step: 2 Unlock
Step: 3 Unlock