

Question: Refer to Table S6.1 - Factors for Computing Control Chart Limits (3 sigma) for this problem. have been as follows: begin{tabular}{ccc} hline Day & Meanx(mm)
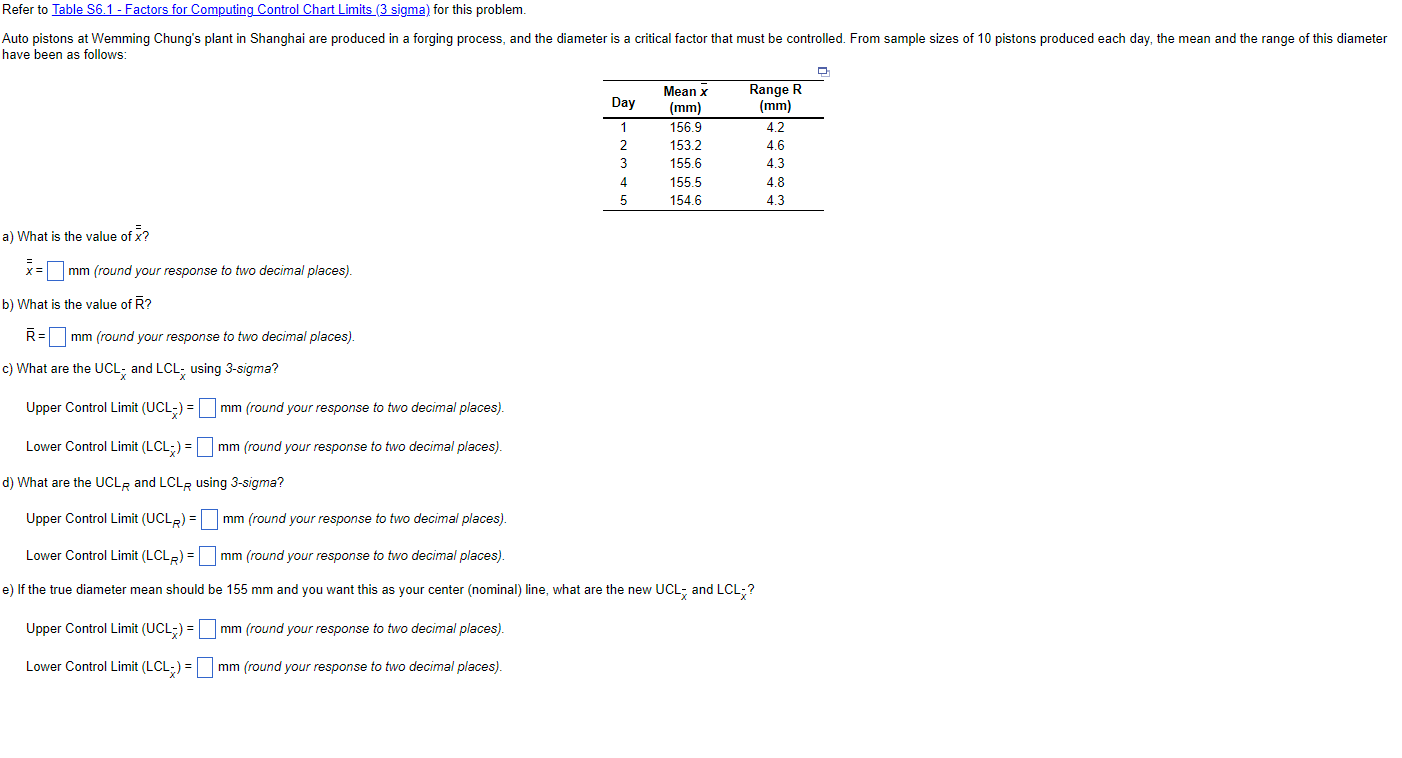
Refer to Table S6.1 - Factors for Computing Control Chart Limits (3 sigma) for this problem. have been as follows: \begin{tabular}{ccc} \hline Day & Meanx(mm) & RangeR(mm) \\ \hline 1 & 156.9 & 4.2 \\ 2 & 153.2 & 4.6 \\ 3 & 155.6 & 4.3 \\ 4 & 155.5 & 4.8 \\ 5 & 154.6 & 4.3 \\ \hline \end{tabular} a) What is the value of x ? x=mm(roundyourresponsetotwodecimalplaces). b) What is the value of R ? R=mm(roundyourresponsetotwodecimalplaces). c) What are the UCL and LCL using 3-sigma? Upper Control Limit (UCL)=mm (round your response to two decimal places). Lower Control Limit (LCL)=mm (round your response to two decimal places). d) What are the UCLR and LCLR using 3-sigma? Upper Control Limit (UCLR)=mm (round your response to two decimal places). Lower Control Limit (LCLR)=mm (round your response to two decimal places). e) If the true diameter mean should be 155mm and you want this as your center (nominal) line, what are the new UCL and LCL ? Upper Control Limit (UCL)=mm (round your response to two decimal places). Lower Control Limit (LCL)=mm (round your response to two decimal places)
Step by Step Solution
There are 3 Steps involved in it

Get step-by-step solutions from verified subject matter experts