

Question: Refer to the table below. Draw the appropriate chart using MS EXCEL, also carryout Exponential Smoothing model in MS EXCEL for the given Alpha values,
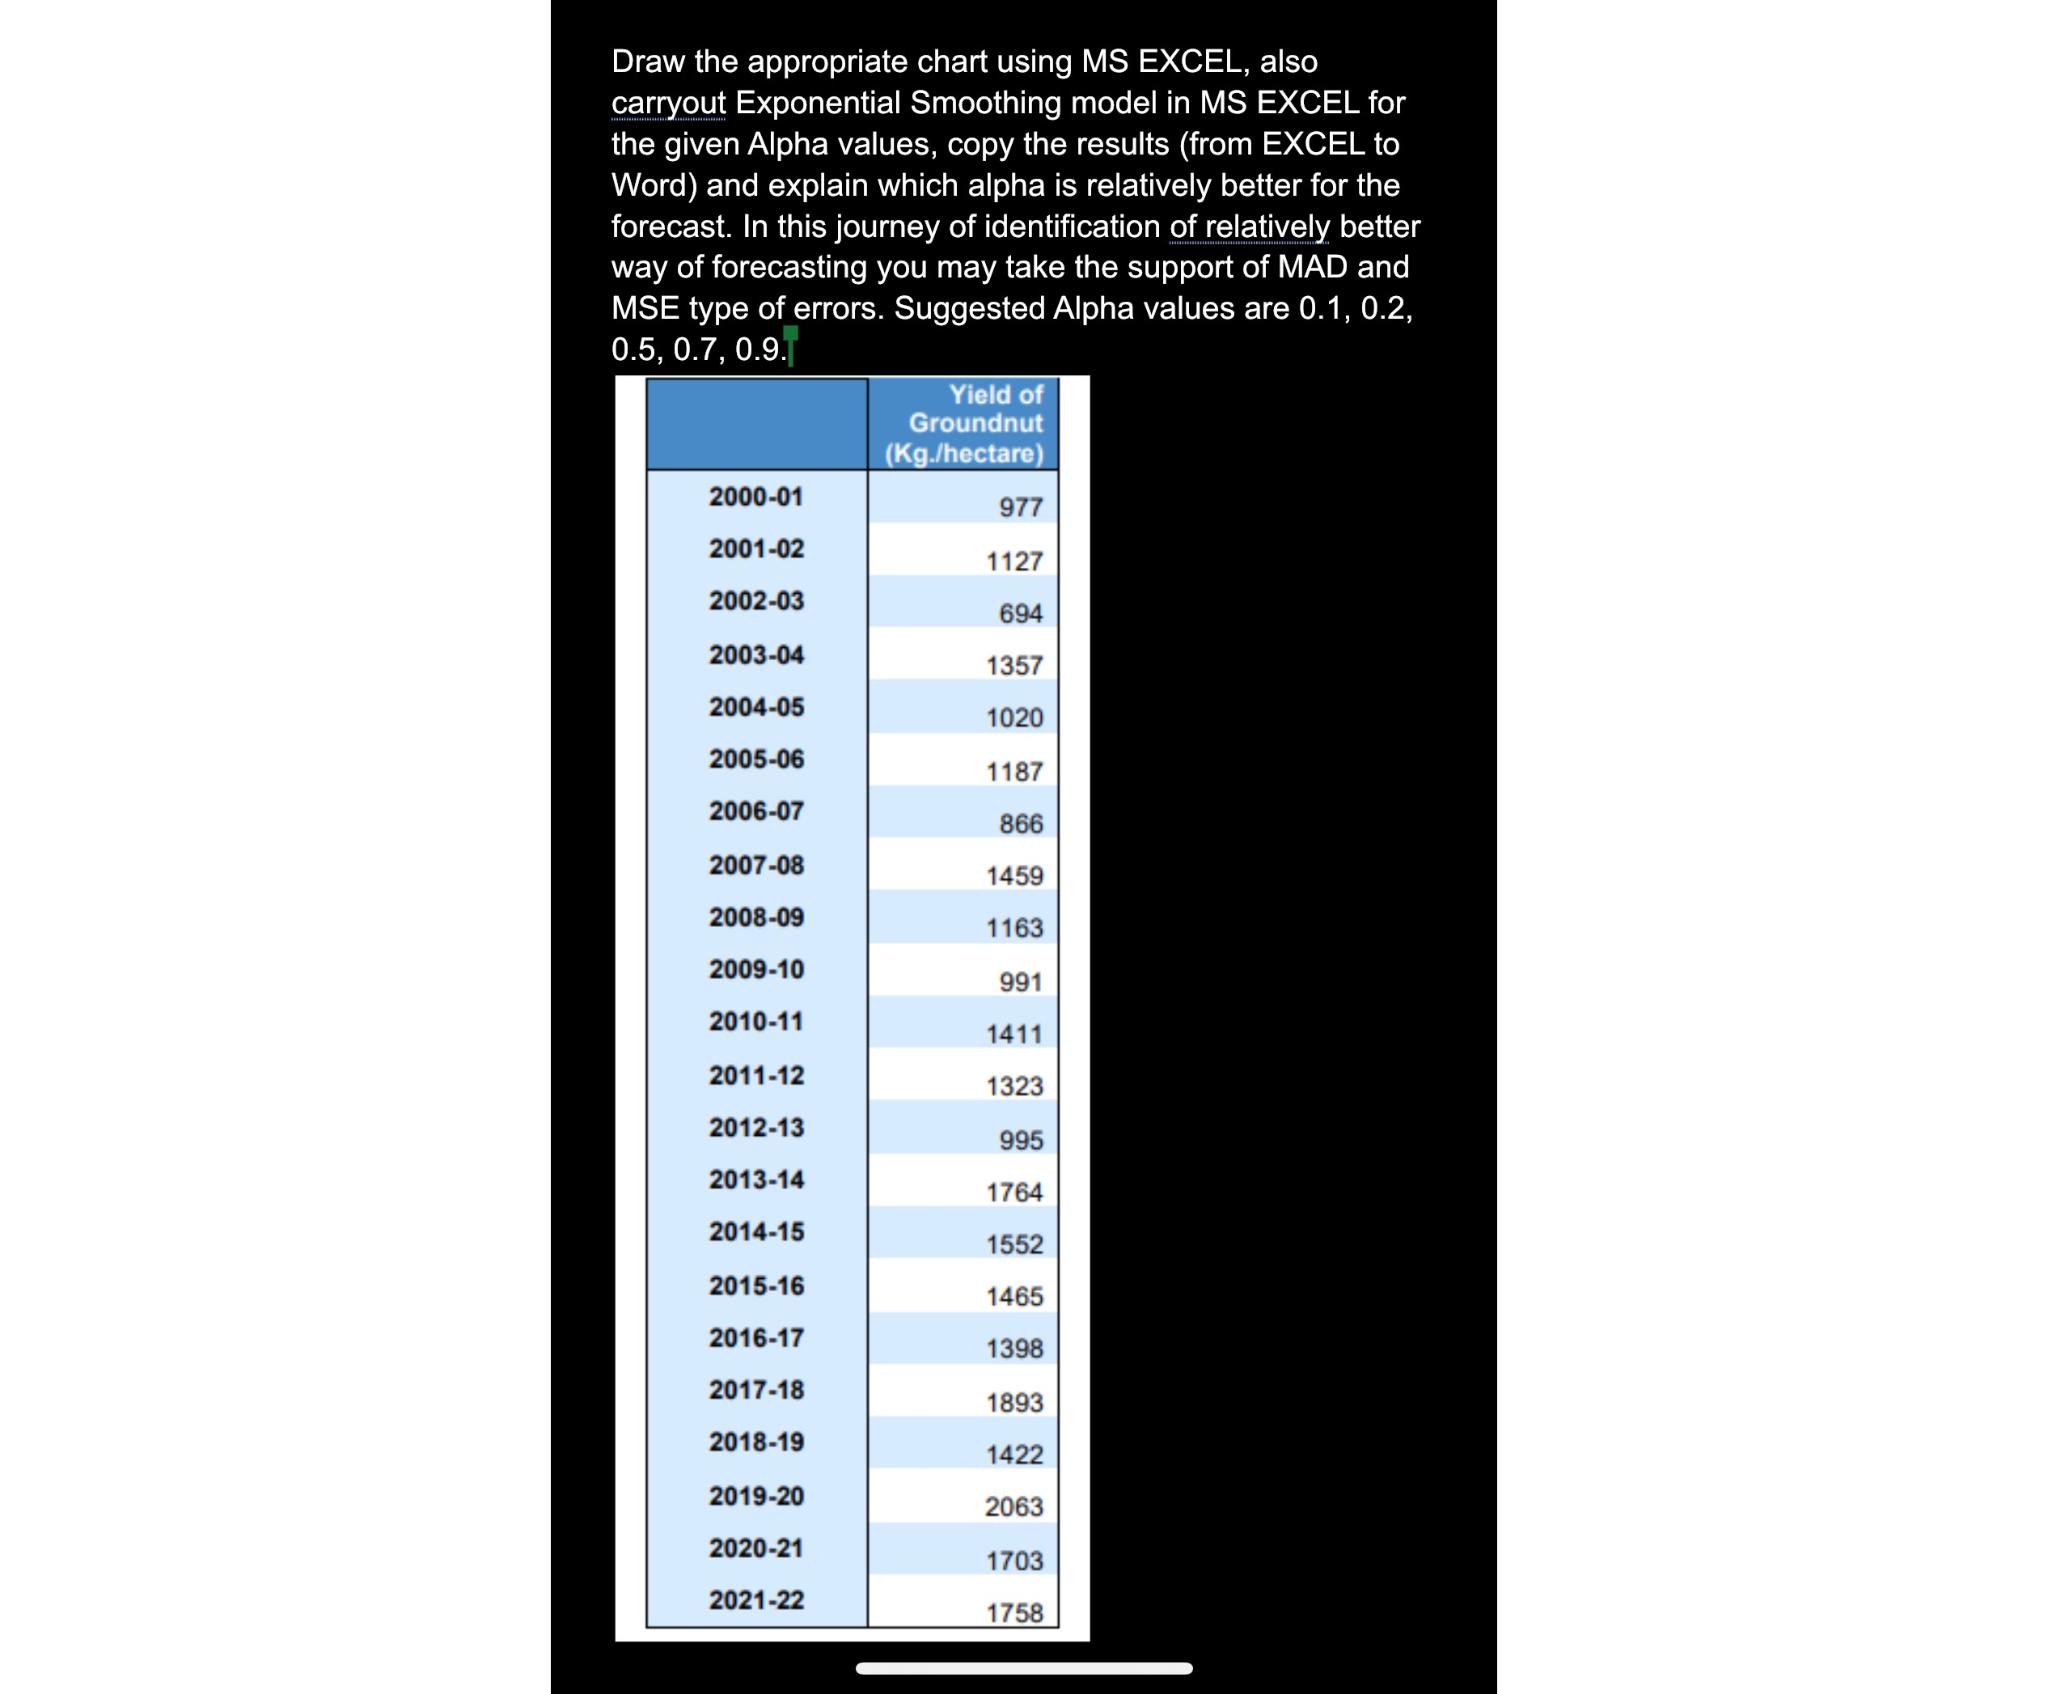
Refer to the table below. Draw the appropriate chart using MS EXCEL, also carryout Exponential Smoothing model in MS EXCEL for the given Alpha values, copy the results from EXCEL to Word and explain which alpha is relatively better for the forecast. In this journey of identification of relatively better way of forecasting you may take the support of MAD and MSE type of errors. Suggested Alpha values are
Step by Step Solution
There are 3 Steps involved in it
1 Expert Approved Answer
Step: 1 Unlock

Question Has Been Solved by an Expert!
Get step-by-step solutions from verified subject matter experts
Step: 2 Unlock
Step: 3 Unlock