

Question: Refer to the table Eactors for. Computing Control Chart Limits (3 rigang) for this problem. A process at Amit Eynan Boilling Company that is consideced
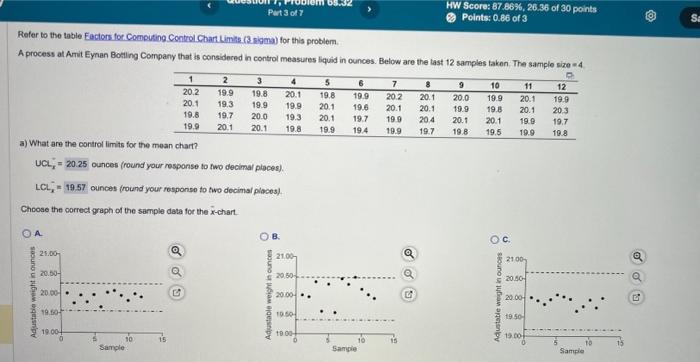
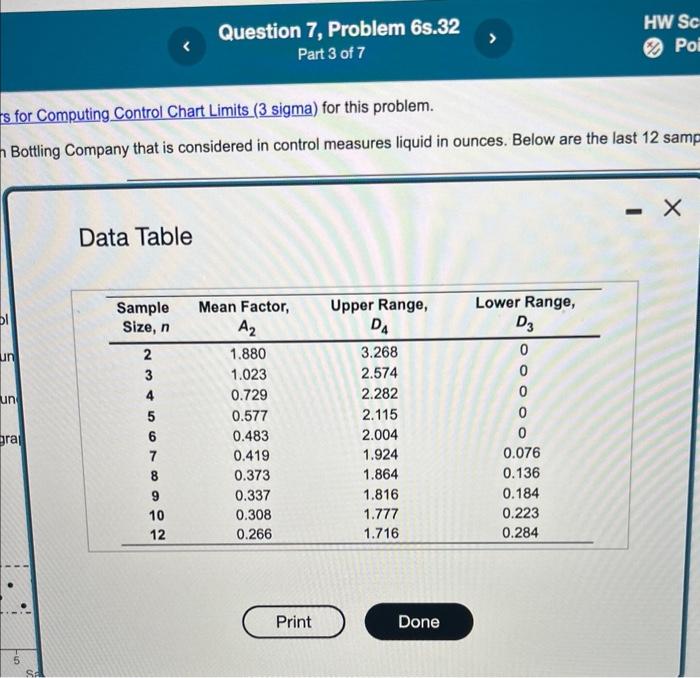
Refer to the table Eactors for. Computing Control Chart Limits (3 rigang) for this problem. A process at Amit Eynan Boilling Company that is consideced in control measures liquid in ounces. Below are the last 12 samples taken. The sample size = 4. a) What are the control limits for the mean chart? UCLxn=20.25 ounces (round your response to two decimal places). LCLx=19.57 ounces (round your rosponso to two decimal places). Choose the oorrect qraph of the sample data for the x-chart. Data Table
Step by Step Solution
There are 3 Steps involved in it
1 Expert Approved Answer
Step: 1 Unlock

Question Has Been Solved by an Expert!
Get step-by-step solutions from verified subject matter experts
Step: 2 Unlock
Step: 3 Unlock