

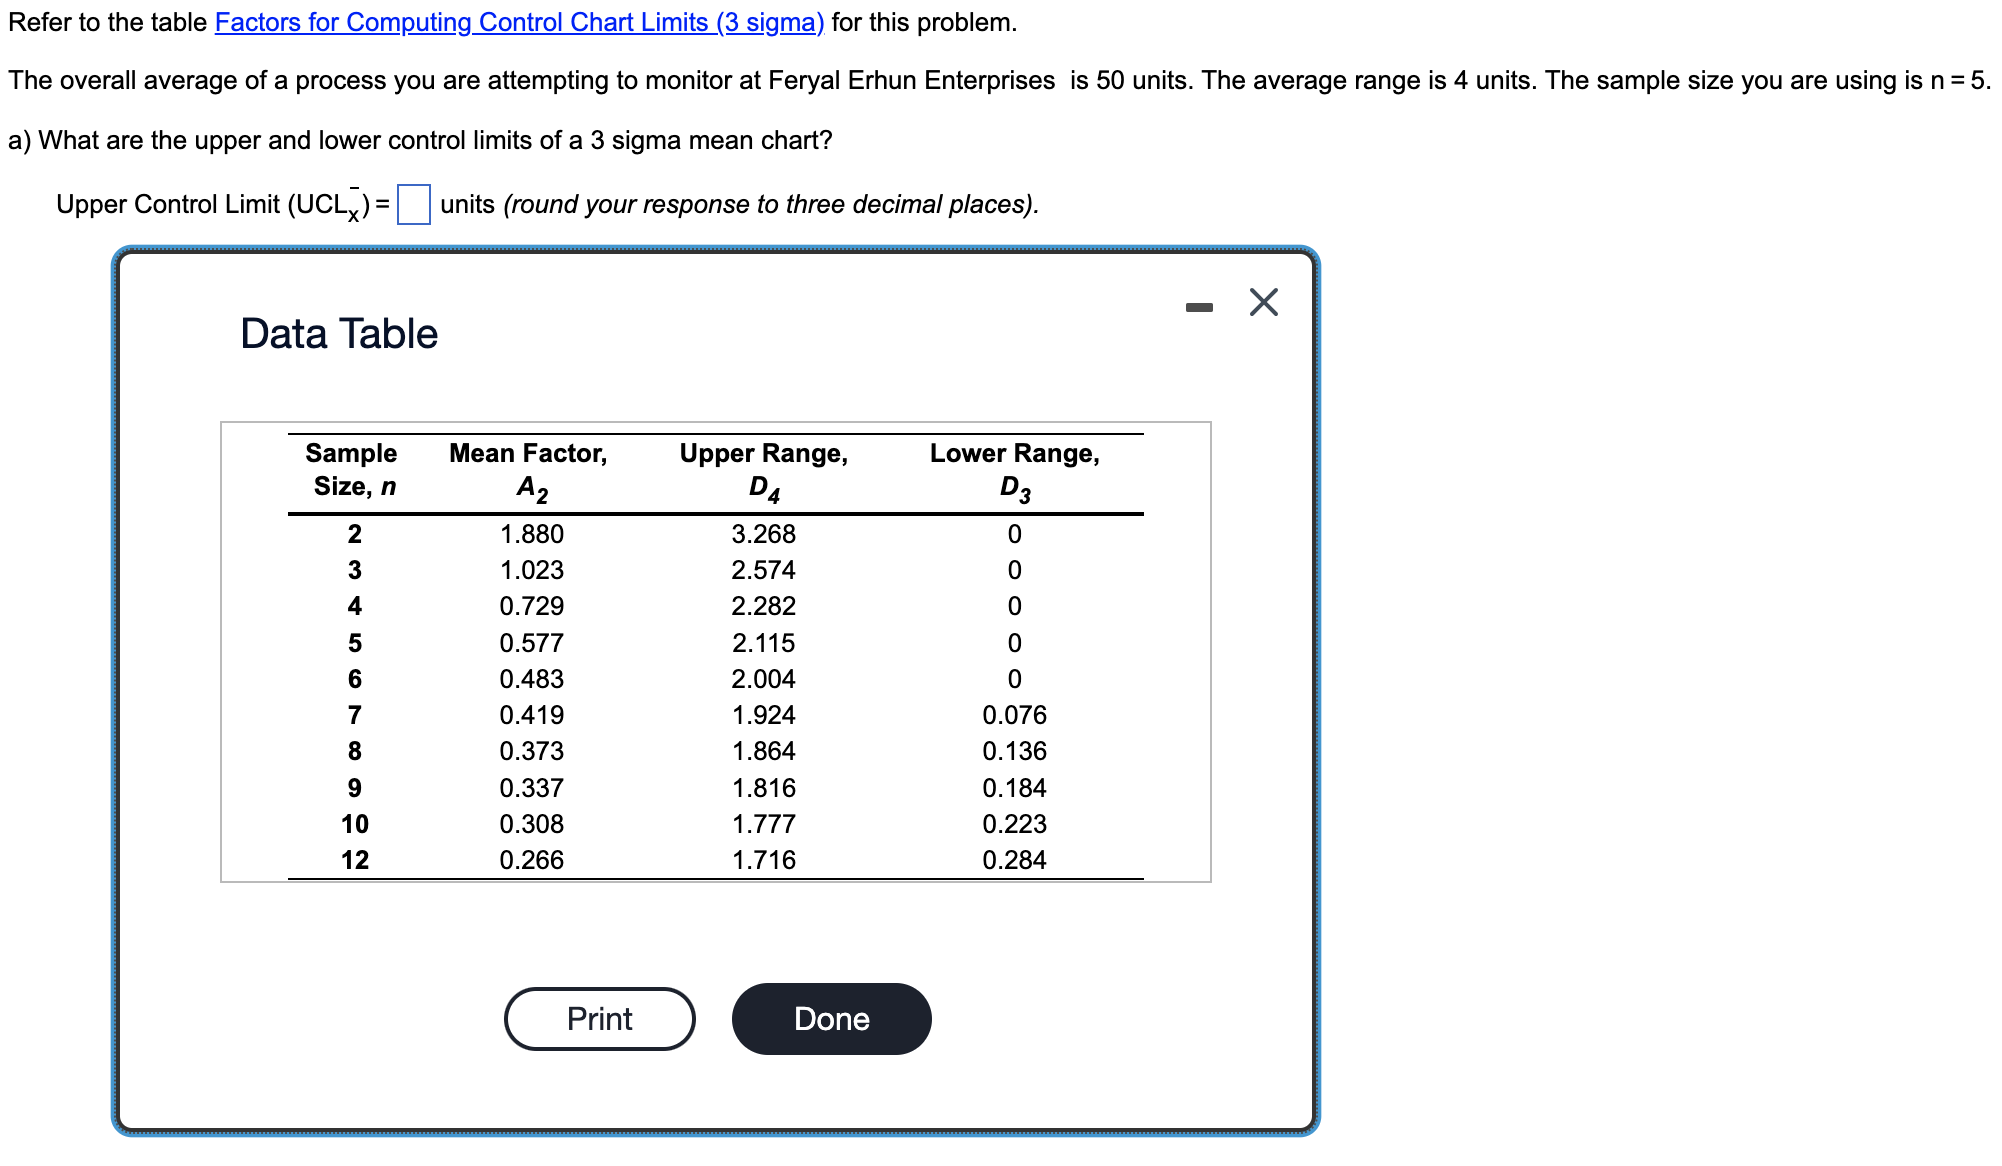
Question: Refer to the table Factors for Computing Control Chart Limits ( 3 sigma ) for this problem. The overall average of a process you are
Refer to the table Factors for Computing Control Chart Limits sigma for this problem.
The overall average of a process you are attempting to monitor at Feryal Erhun Enterprises is units. The average range is units. The sample size you are using is
a What are the upper and lower control limits of a sigma mean chart?
Upper Control Limit units round your response to three decimal places
Step by Step Solution
There are 3 Steps involved in it
1 Expert Approved Answer
Step: 1 Unlock

Question Has Been Solved by an Expert!
Get step-by-step solutions from verified subject matter experts
Step: 2 Unlock
Step: 3 Unlock