

Question: Refer to the table from the previous problem (provided below) to answer the question. West East North Total Non-Defective 96 1073 1204 2373 Defective 13
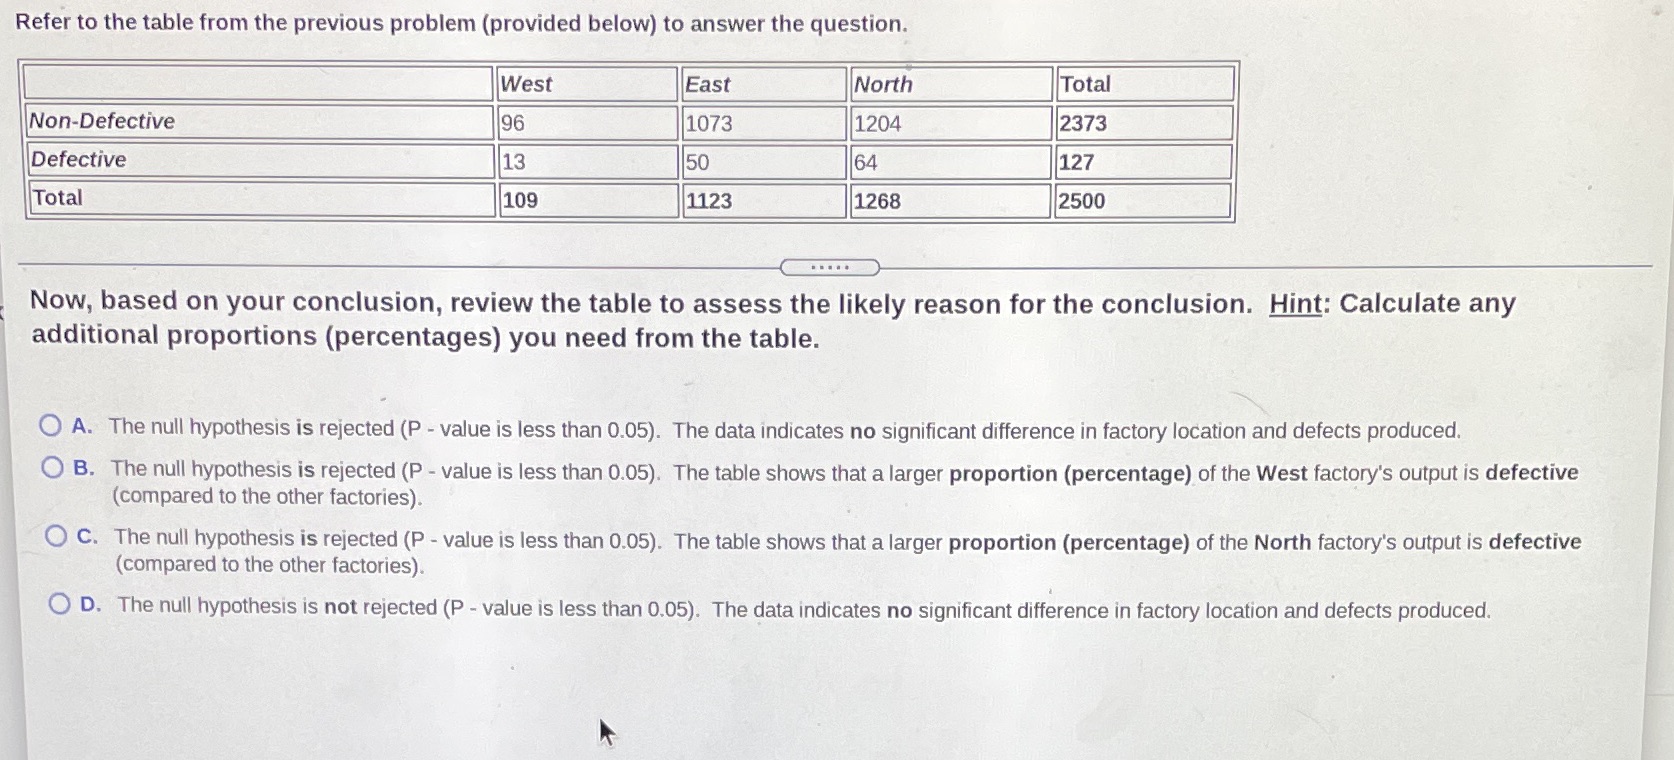
Refer to the table from the previous problem (provided below) to answer the question. West East North Total Non-Defective 96 1073 1204 2373 Defective 13 50 64 127 Total 109 1123 1268 2500 Now, based on your conclusion, review the table to assess the likely reason for the conclusion. Hint: Calculate any additional proportions (percentages) you need from the table. O A. The null hypothesis is rejected (P - value is less than 0.05). The data indicates no significant difference in factory location and defects produced. O B. The null hypothesis is rejected (P - value is less than 0.05). The table shows that a larger proportion (percentage) of the West factory's output is defective (compared to the other factories). O C. The null hypothesis is rejected (P - value is less than 0.05). The table shows that a larger proportion (percentage) of the North factory's output is defective (compared to the other factories). O D. The null hypothesis is not rejected (P - value is less than 0.05). The data indicates no significant difference in factory location and defects produced
Step by Step Solution
There are 3 Steps involved in it

Get step-by-step solutions from verified subject matter experts