

Question: Reference data (dataset.csv in the code or log-returns of 10 stocks in the question): Risk Parity Portfolio (RPP) aims at equalizing the risk contribution from
Reference data (dataset.csv in the code or log-returns of 10 stocks in the question):
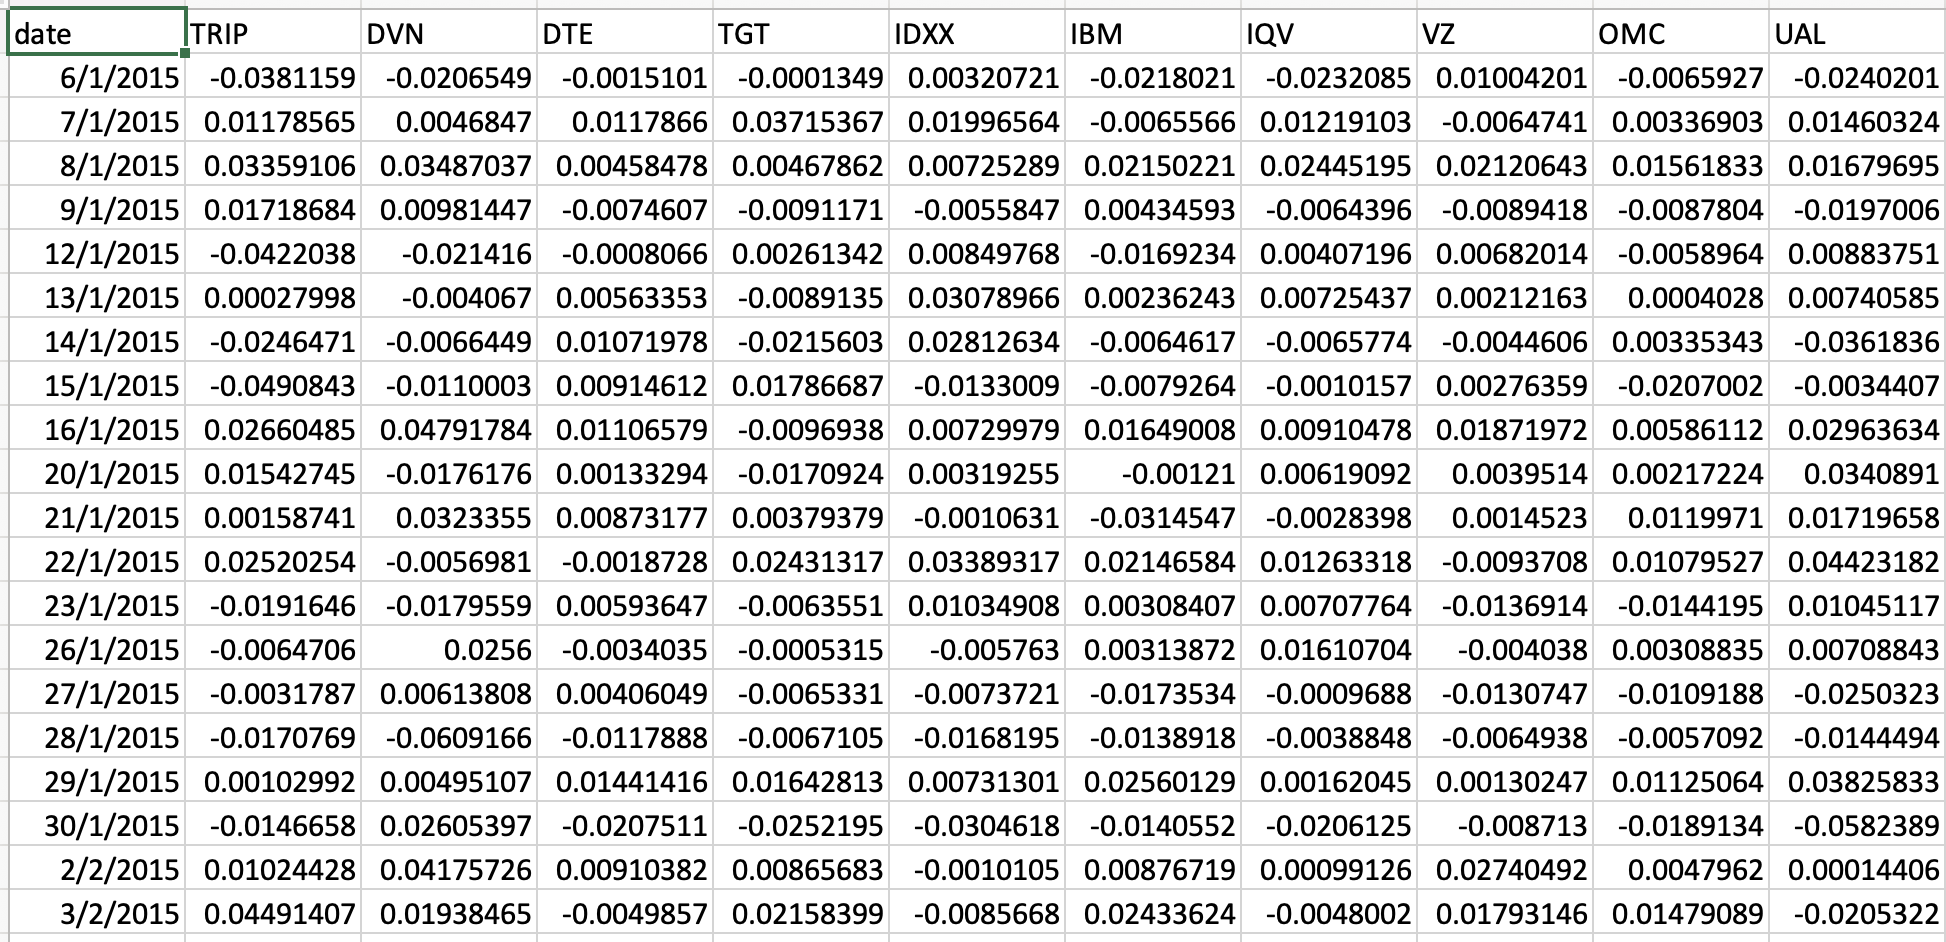
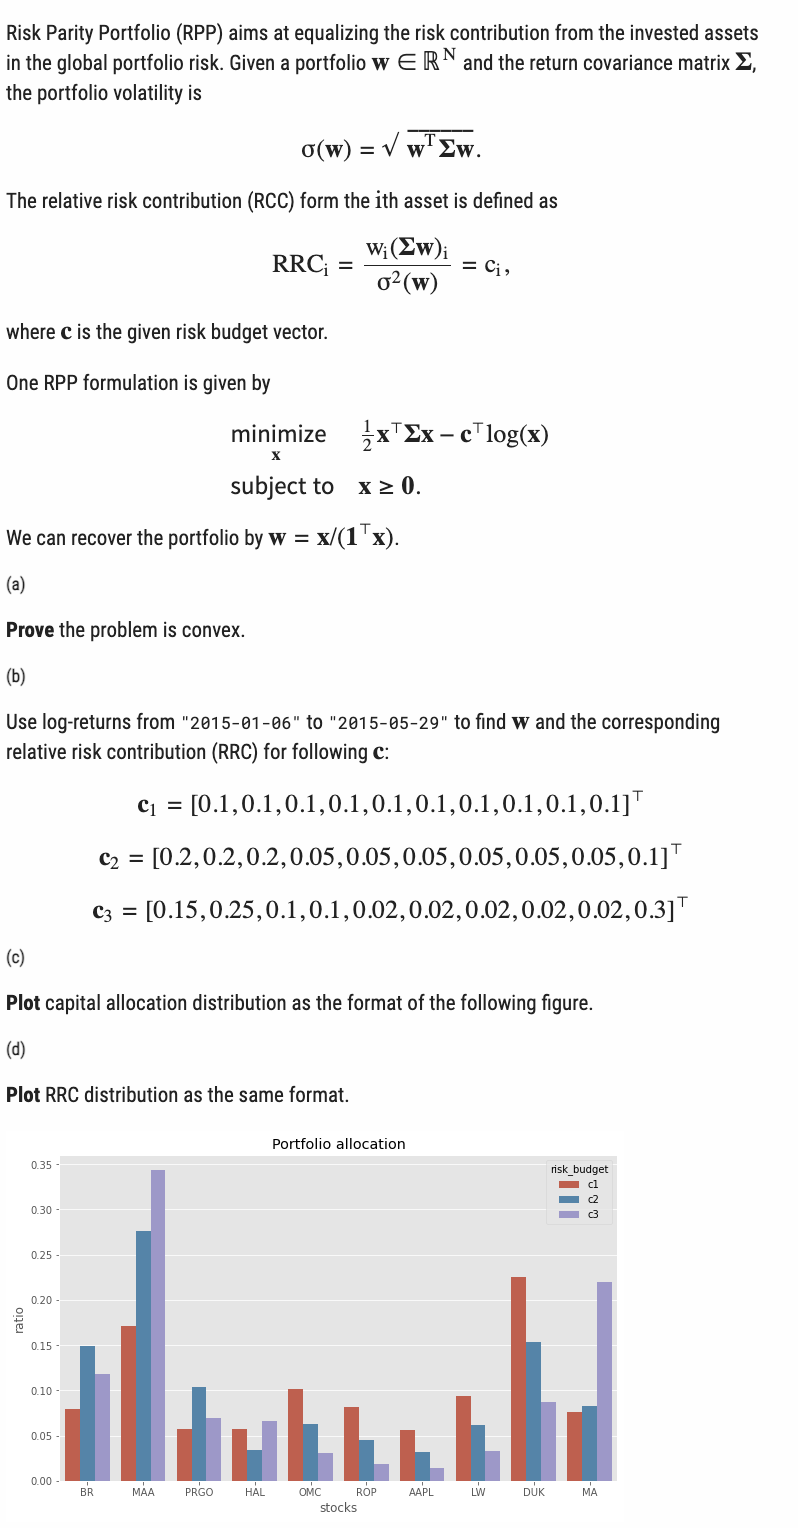
Risk Parity Portfolio (RPP) aims at equalizing the risk contribution from the invested assets in the global portfolio risk. Given a portfolio wRN and the return covariance matrix , the portfolio volatility is (w)=wTw The relative risk contribution (RCC) form the ith asset is defined as RRCi=2(w)wi(w)i=ci, where c is the given risk budget vector. One RPP formulation is given by xminimizesubjectto21xxclog(x)x0. We can recover the portfolio by w=x/(1x) (a) Prove the problem is convex. (b) Use log-returns from "2015-01-06" to "2015-05-29" to find w and the corresponding relative risk contribution (RRC) for following c : c1=[0.1,0.1,0.1,0.1,0.1,0.1,0.1,0.1,0.1,0.1]c2=[0.2,0.2,0.2,0.05,0.05,0.05,0.05,0.05,0.05,0.1]c3=[0.15,0.25,0.1,0.1,0.02,0.02,0.02,0.02,0.02,0.3] (c) Plot capital allocation distribution as the format of the following figure. (d) Plot RRC distribution as the same format. Risk Parity Portfolio (RPP) aims at equalizing the risk contribution from the invested assets in the global portfolio risk. Given a portfolio wRN and the return covariance matrix , the portfolio volatility is (w)=wTw The relative risk contribution (RCC) form the ith asset is defined as RRCi=2(w)wi(w)i=ci, where c is the given risk budget vector. One RPP formulation is given by xminimizesubjectto21xxclog(x)x0. We can recover the portfolio by w=x/(1x) (a) Prove the problem is convex. (b) Use log-returns from "2015-01-06" to "2015-05-29" to find w and the corresponding relative risk contribution (RRC) for following c : c1=[0.1,0.1,0.1,0.1,0.1,0.1,0.1,0.1,0.1,0.1]c2=[0.2,0.2,0.2,0.05,0.05,0.05,0.05,0.05,0.05,0.1]c3=[0.15,0.25,0.1,0.1,0.02,0.02,0.02,0.02,0.02,0.3] (c) Plot capital allocation distribution as the format of the following figure. (d) Plot RRC distribution as the same format
Step by Step Solution
There are 3 Steps involved in it

Get step-by-step solutions from verified subject matter experts