

Question: Regression Analysis Using Microsoft Excel This example shows you how to run an Ordinary Least Squares (OLS) regression step-by- step using Excel. It describes a
Regression Analysis Using Microsoft Excel This example shows you how to run an Ordinary Least Squares (OLS) regression step-by- step using Excel. It describes a simple regression of the excess returns for GE on the excess returns for S&P 500 and allows us to calculate GE's beta using the CAPM. Step 1: General Electric Company (NYSE: GE) In the example we use monthly returns for T-Bills, the S&P500, and for GE. We find the returns for T-Bills in column B, for the S&P 500 in column C, and for GE in column D. The CAPM requires you to regress the excess returns for GE (rGE - rf) on the excess returns for the S&P500 (rS&P - rf). The excess returns for the S&P 500 and GE are calculated in Columns F and G. Click on the cells to see how the excess returns were calculated. Step 2: Use the mouse and go to Data at the top of your excel window. Click on Data Analysis and the dialogue box labeled Data Analysis will appear. (If you don't have Data Analysis as an option, you need to load the Analysis ToolPak add-in program as explained below). Scroll down the list of options in this dialogue box until you find Regression and highlight Regression with your mouse. After you have highlighted Regression, click the OK. Step 3: Review the idea of regression. To fill in the correct data ranges, you have to know your Y (Input Y range) and your X (Input X range) variables. Calculating GEs beta means that you want to calculate how much GEs price changes in response to a change in the S&P 500. yi = alphai + betai (x) + ei, where: y = excess returns for GE (rGE - rf), x = excess returns for the Market (rS&P - rf), alpha = intercept, beta = GEs beta. Remember that the slope (beta) is the rise divided by the run! A regression package calculates this automatically for you and labels this slope as coefficient. How do we fill in the Regression dialogue box? Input Y range = excess returns for GE = $F$1:$F$61 Input X range = excess returns for the Market (RS&P - rf) = $H$1:$H$61
2 You may enter the Input ranges by clicking the mouse in the rectangle and then using the mouse to highlight the range of cells on the spreadsheet. The first row contains the labels of our variables, so we also check Labels box.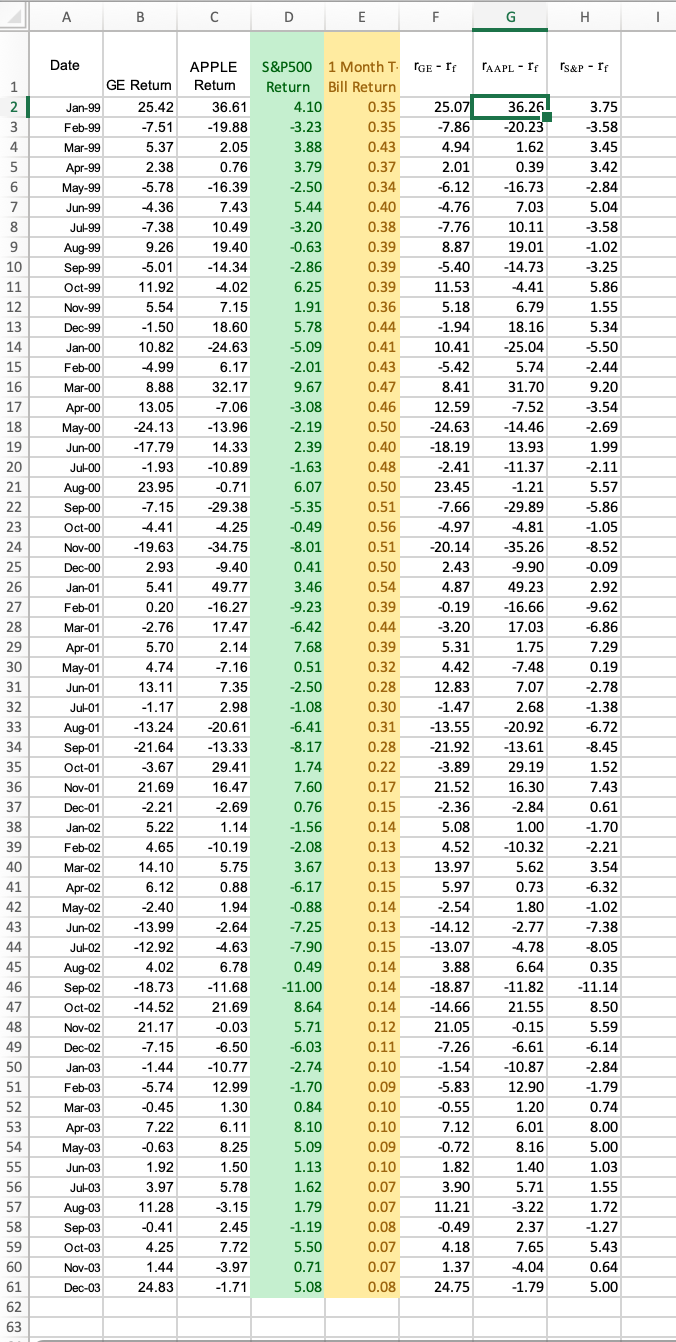
Step by Step Solution
There are 3 Steps involved in it

Get step-by-step solutions from verified subject matter experts