

Question: Regression and correlation Please help show work and explain. Problem set 2: use the following information to answer questions 5-9 (30 points total): Let's examine
Regression and correlation
Please help show work and explain.
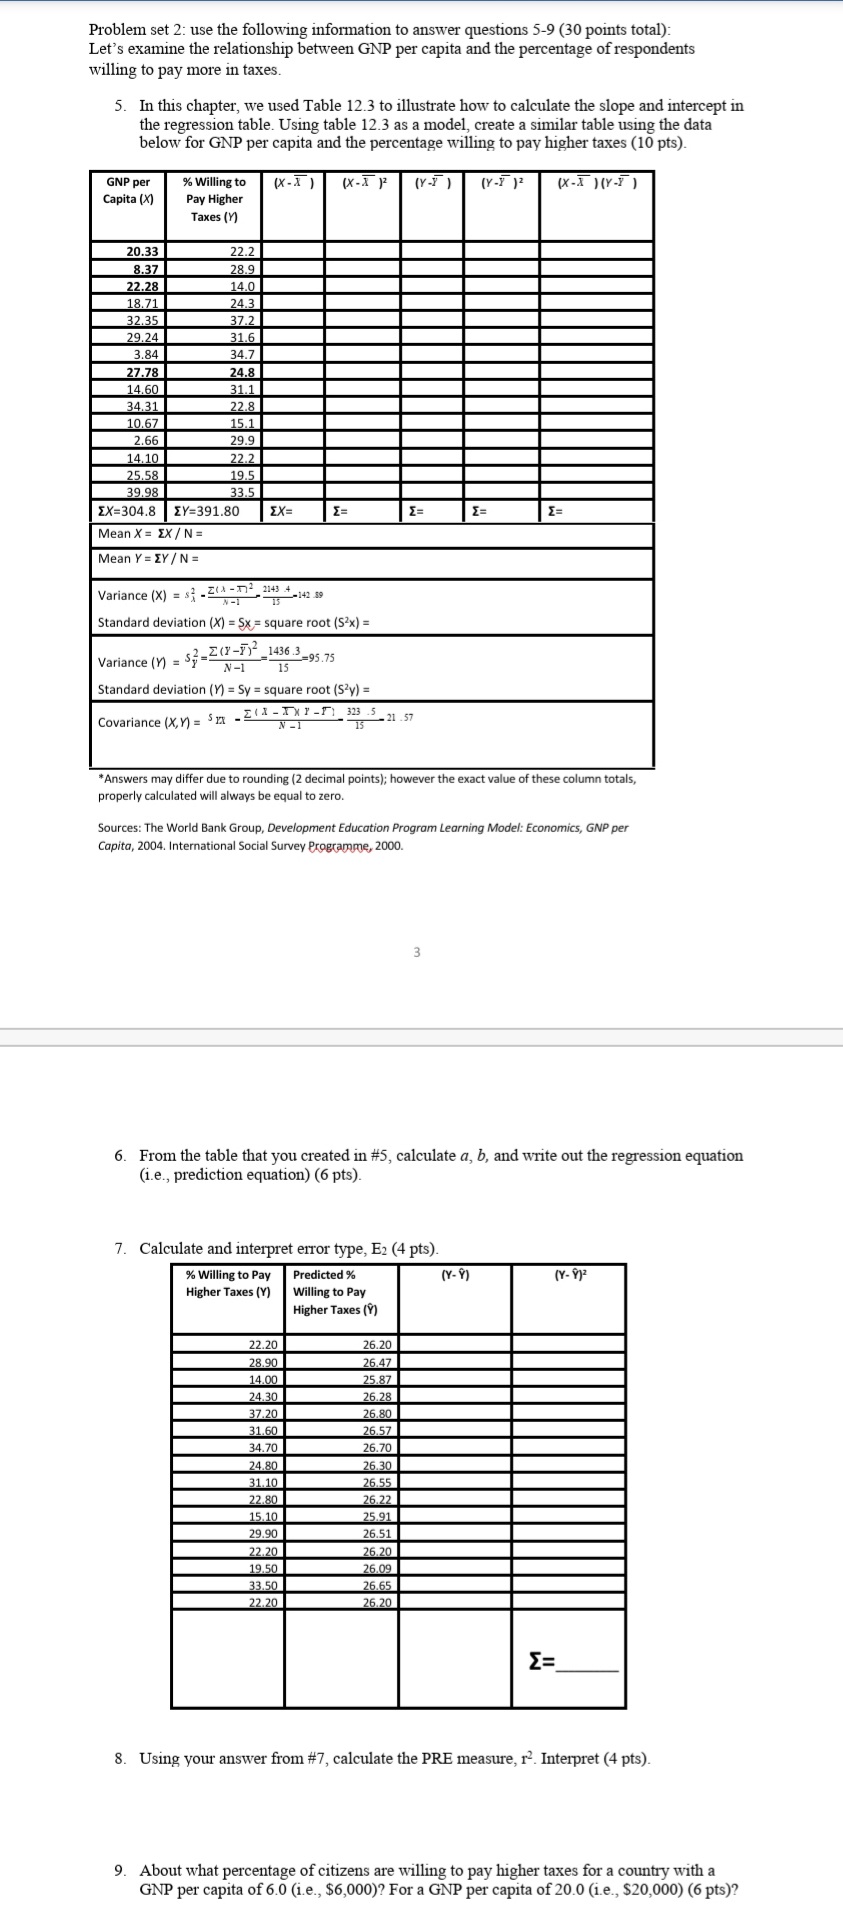
Problem set 2: use the following information to answer questions 5-9 (30 points total): Let's examine the relationship between GNP per capita and the percentage of respondents willing to pay more in taxes. 5. In this chapter, we used Table 12.3 to illustrate how to calculate the slope and intercept in the regression table. Using table 12.3 as a model, create a similar table using the data below for GNP per capita and the percentage willing to pay higher taxes (10 pts). GNP per Willing to ( X - X ) (X-X )2 ( Y -5 ) (Y-1 ) 2 ( X - 1 ) ( Y - ] ) Capita (X) Pay Higher Taxes (1) 20.33 22.2 8.37 28.9 22.28 14.0 18.71 24.3 32.35 37.2 29.24 31.6 3.84 34.7 27.78 24.8 14.60 31.1 34.31 22.8 10.67 15.1 2.66 29.9 14.10 22.2 25.58 19.5 39.98 33.5 EX=304.8 EY=391.80 EX = Mean X = EX / N= Mean Y = EY / N = Variance (X) = s? _ Z( -x2 2143 4 N - 1 -142 59 Standard deviation (X) = $x = square root ($2x) = Variance (1) = $2 =20-Y) 1 1436.3- N-1 =95.75 Standard deviation ()) = Sy = square root (Say) = Covariance (X,Y) = $1x - 2(1 - XXY-Fi_ 323 .5_21.57 N - I Answers may differ due to rounding (2 decimal points); however the exact value of these column totals, properly calculated will always be equal to zero. Sources: The World Bank Group, Development Education Program Learning Model: Economics, GNP per Capita, 2004. International Social Survey Programme, 2000. 6. From the table that you created in #5, calculate a, b, and write out the regression equation (i.e., prediction equation) (6 pts). 7. Calculate and interpret error type, E2 (4 pts). % Willing to Pay Predicted % ( Y - P ) (Y- P)2 Higher Taxes (Y) Willing to Pay Higher Taxes (Y) 22.20 26.20 28.90 26.47 4.00 25.87 4.30 26.28 37.20 26.80 31.60 26.57 $4.70 26.70 24.80 26.30 31.10 26.55 22.80 26.22 15.10 25.91 29.90 26.51 22.20 26.20 19.50 26.09 33.50 26.65 22.20 26.20 [= 8. Using your answer from #7, calculate the PRE measure, r. Interpret (4 pts). 9. About what percentage of citizens are willing to pay higher taxes for a country with a GNP per capita of 6.0 (i.e., $6,000)? For a GNP per capita of 20.0 (i.e., $20,000) (6 pts)
Step by Step Solution
There are 3 Steps involved in it

Get step-by-step solutions from verified subject matter experts