

Question: Remember, the expected value of a probabl ity distribution is a statistical measure of the average (mean) value expected to occur during all possible circumstances
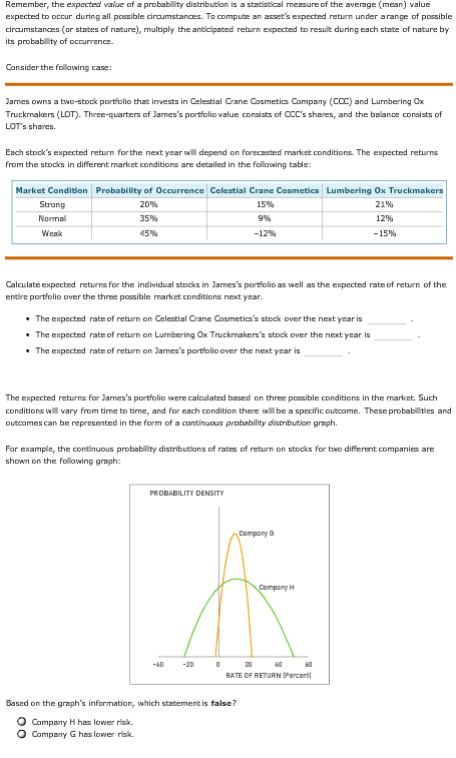
Remember, the expected value of a probabl ity distribution is a statistical measure of the average (mean) value expected to occur during all possible circumstances To compute an asset's expected return under arange of possible ciraumstances (or states of nature), multiply the anticpated return expected to resut during each state of nature by ts probabl ity of occurrence. Consider the following case James owns a two-stock portfolio that invests in Celestial Crane Cosmetics Company (COC) and Lunbering Ox Truckmakers (LOT). Three-quarters of Jarnes's portfollio value consists of CCC's shares, and the balance consists of LOT's shares Each stock's expected return for the next year wll depend on forecasted market conditions. The expected returns from the stocks in different market conditions are detailled in the following table: Market Condition Probability of Occurrence Celestial Crane Cosmetics Lumbering Ox Truckmakers 21% 12% 15% Strang Normal Weak 20% 35% 45% 15% 9% Calculate expected returns for the individual stocks in James's portfolio as well as the expected rate of return of the entire portfolio over the three possible market conditions next year The expected rate of return on Celestial Crane Cosmetics's stock over the next year is The expected rate of return on Lumbering Ox Truckmakers's stock over the next year is The expected rate of return on Jarmes's portfolio over the next year is The expected returns for Jarmes's portfolio were calculated based on three possible conditions in the market Such conditions wl vary from time to time, and for each condition there wibe a specific outcome. These probabllities and outcomes can be represented in the form of a continuous probability distribution graph. For example,the continuous probability distributions of ratrs of return on stocks for two different companies are hown on the follawing graph: PROBABILITY DENSITY Company G RATE OF RETURN Percent Based on the graph's information, which statement s false? O Campany H has lower risk. Campany G has lower risk
Step by Step Solution
There are 3 Steps involved in it

Get step-by-step solutions from verified subject matter experts