

Question: Repost, this is about matlab.. i already asked this but they didnt follow imstructions and even provided much worse codes than what i got. PLEASE
 Repost, this is about matlab..
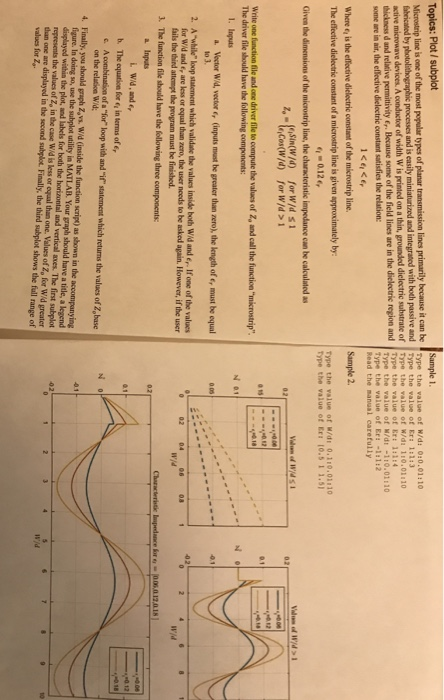
 Microatripline is one of the most poalar pypes of planar transmission lines primarily becnuse it can be yee the value of W/d: 0:0.01:10 Type the value of En in,3 dielectric substrate of Type the value of W/di 110.0110 active microwave devices. A conductor of width W is printed on a thin, tr, the Talue or Et Type the value of Midi-110.01110 ve permittivity . Because some of the field li my er. Because some of the field lines are in the dielectric region and Type the value of Ers-1s1:2 Read the manual carefully some are in air, the effective dielectric constant satisfies the relation Where e, is the effective dielectric constant of the microstrip line. The effective dielectric constant of a microstrip line is given approximately by Type the value of W/di 0.110.0110 Type the value of Er: 10.511.5 0.12 Given the dimensions of the microstrip line, the characteristic impedance can be calculated as Sin(W/) for Wid s1 Write one function file and one driver file to compute the values of Z, and call the function "microstrip" The driver file should have the following components I. Inputs a. Vector W/d, vector e, (inputs must be greater than zero), the length of e, must be equal 2. A-while-loop statement which validat, the values inside both wid and er. If one of the values for W/d and e, are lkss or equal than zero, the user needs to be asked again. However, if the user 0 02 04 06 08 fails the third atlcmpt the peogram must be finished. 3. The function file should have the following three composents: L WId, and e b. The equation for ey in terms of e, c. A combination of a "for" loop with and "if" statement which returns the values of Z, base on the relation Wid figure. In doing so, use the in MATLAB. Your graph should have a title, a legend displayed within the plot, and labels for both the horizontal and vertical axes. The first subplot represents the values of Z, in the case Wid is less or oqual than one. Values of Z, for Wid greater dhan one are displayed in the second subplot. Finally, the third subplot shows the full range of values for Z
Step by Step Solution
There are 3 Steps involved in it

Get step-by-step solutions from verified subject matter experts